New Members: Be sure to confirm your email address by clicking on the link that was sent to your email inbox. You will not be able to post messages until you click that link.
linear or logarithmic charts?

Marty
✭
in SharpCharts
Motley Fool says logarithmic works best for displaying exponential growth. Do you agree? I see linear exponential graphs all the time. I've attached two examples, one linear and one logarithmic.
Motley Fool says logarithmic. The Fred chart below is logarithmic. Here's the Fool source: http://www.fool.com/foolfaq/foolfaqcharts.htm
Motley Fool says logarithmic. The Fred chart below is logarithmic. Here's the Fool source: http://www.fool.com/foolfaq/foolfaqcharts.htm
0
Best Answer
-
Here's a post I made over on IHUB back in Oct. 2008 which I think addresses the issue.
"Long term charts, Linear vs Log
On a few other sites a couple of days ago people were posting chart links to the INDU comparing the present to 1987 and showing that 87 was not such a big deal.
Well the only problem was those charts were using the linear scale which is very misleading when looking at the long term. Problem is a constant growth of say 10% per period on a linear chart is an exponential curve, parabolic uptrend. Its much easier to view on a log scale which will be a straight line over time.
I put together the following image which shows the comparison of linear vs log charts for both 5 & 10% growth per period. I also show how it would look if there was a change in growth, 10% 1st half the 5% for the 2nd half.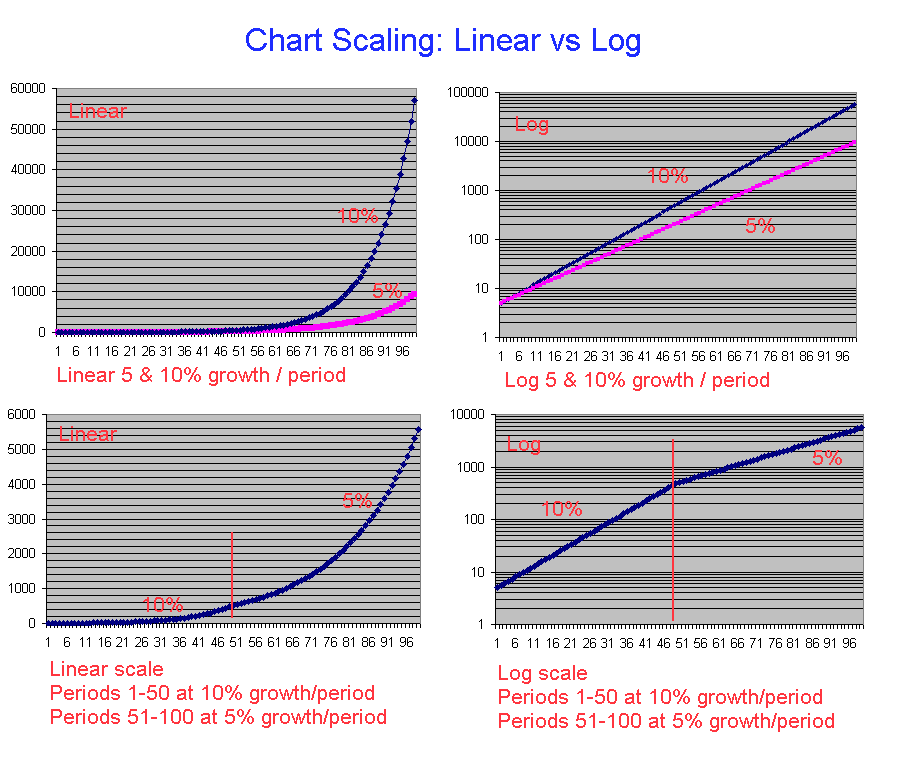
Now here is the chart of the INDU from 1980 to present, linear and log scales. The advantage of the log chart for long time frames is that a 10% price change anywhere on the chart is represented by the same vertical "Y axis" distance.
Note I've also added the MACD to the bottom of the chart, for long term charts this is also a problem because its based the magnitude of price movements over time. Price movements today are very much larger than they were in the 80's, BUT we really need to look at the percentage changes to make a fair normalized comparison over time. Thus I use the PPO, which is exactly the MACD but calculated on a percentage basis and as you can see provides better long term information.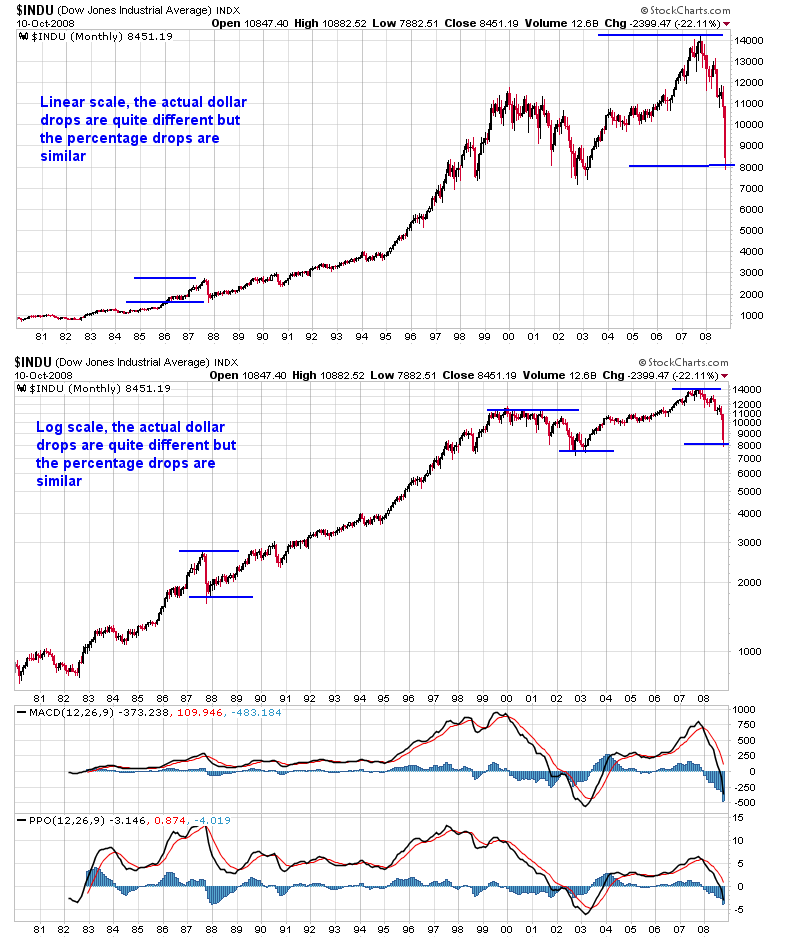
""
cheers
Gord
0

Answers
-
ChartSchool uses the term Arithmetic. I assume that Arithmetic and Linear mean the same thing for this topic?
 0
0 -
Yep Arithmetic and Linear mean the same thing.0

Categories
- All Categories
- 2.3K StockCharts
- 395 SharpCharts
- 146 Other Charting Tools
- 69 Saved Charts and ChartLists
- 1.5K Scanning
- 74 Data Issues
- 177 Other StockCharts Questions
- 218 Technical Analysis
- 155 Using Technical Analysis
- 2 InterMarket and International
- 19 Market and Breadth Indicators
- 42 Market Analysis
- 109 Trading
- 109 Trading Strategies
- 163 S.C.A.N the StockCharts Answer Network forum
- 65 Using this StockCharts Answer Network forum
- 98 s.c.a.n. archives
- 5 Off-Topic
- 6 The Cogitation & Rumination Emporium
- Forum Test Area