New Members: Be sure to confirm your email address by clicking on the link that was sent to your email inbox. You will not be able to post messages until you click that link.
Weekly indicator on daily chart.

in SharpCharts
Once more (thanks gord):
Is it possible to get weekly MACD on daily chart?
(We can see it in the book - J. Murphy, The Visual Investor, Second Edition, p.131)
Or is there another option? (thanks Kevo)
Is it possible to get weekly MACD on daily chart?
(We can see it in the book - J. Murphy, The Visual Investor, Second Edition, p.131)
Or is there another option? (thanks Kevo)
0
Comments
-
I don't have a copy of "The Visual Investor", can you post a picture of the chart in question as this would be of great help in seeing what John Murphy was actually doing.0
-
-
The illustration doesn't show the parameters used or the values for the indicators, but I'm guessing the weekly MACD is really the daily MACD with the parameters multiplied by 5 - so they would be 70,130,45.
If you try this on a daily chart and compare the same time period on a weekly chart, the MACD pattern is pretty similar - but not identical, since the numbers used in the calculations are not the same (many more numbers used in the daily x 5 version).0 -
I'm not sure what @gord has to say, but I think it is going to be good. That was a good idea to ask for a picture of the chart from the book. @mikimolen thanks for providing it.
That Figure 6.6 looks tricky. It looks like the MACD weekly was simply cut and pasted onto the page. This gives you the false impression it is one chart.
There are a couple of options. The first is to use 10 per page view. Here is a sample: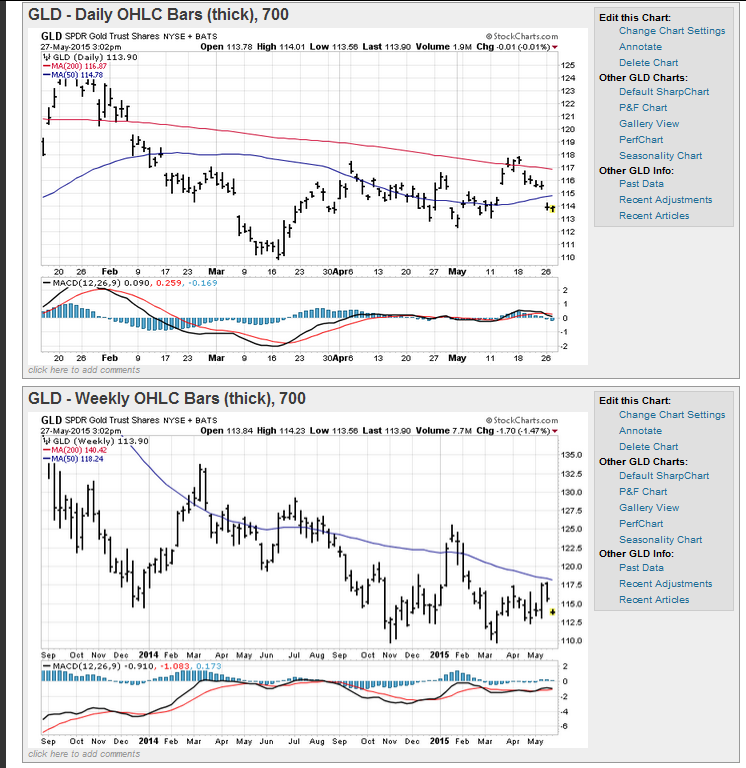
Another tweak: In the weekly chart, you could hide price and just have the MACD indicator.
The second option is to use Gallery View. The default may already have MACD on it. This would be convenient to use. You can even customize your own Gallery View. There are some guidelines. So, ask if you need help.0 -
I agree with the above, looks like it could be the weekly MACD was just cut and pasted onto the bottom of the chart.
However I'm also thinking it might be more as Markd suggested its just a modified daily MACD made to approximate the weekly values, although not exactly. This seems to be confirmed by the daily bars shown in the MACD histogram, if it was a true weekly they would be weekly bars.
Here's a custom gallery view I just made up for the chart, period and dates, it looks very similar. This chart system would also give you the true weekly MACD values, note the weekly bars.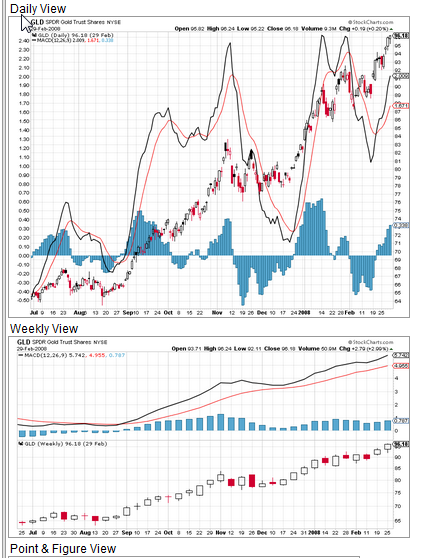
0 -
Thanks to all. It's really great idea from @markd (to use the daily MACD with the parameters multiplied by 5 - ie 70,130,45). Look at the attached illustration with GLD SharpChart from 2007 and "weekly MACD on daily chart" made now. Really good!0


Categories
- All Categories
- 2.3K StockCharts
- 395 SharpCharts
- 146 Other Charting Tools
- 69 Saved Charts and ChartLists
- 1.5K Scanning
- 74 Data Issues
- 177 Other StockCharts Questions
- 218 Technical Analysis
- 155 Using Technical Analysis
- 2 InterMarket and International
- 19 Market and Breadth Indicators
- 42 Market Analysis
- 109 Trading
- 109 Trading Strategies
- 163 S.C.A.N the StockCharts Answer Network forum
- 65 Using this StockCharts Answer Network forum
- 98 s.c.a.n. archives
- 5 Off-Topic
- 6 The Cogitation & Rumination Emporium
- Forum Test Area