New Members: Be sure to confirm your email address by clicking on the link that was sent to your email inbox. You will not be able to post messages until you click that link.
Is there a way to divide stock price by industry group prce

I would like to be able to do something like this
and [0 day ago max(10,close) / 120 day ago $industry max(10,close) > 1.2 ]
Is that possible without finding what the industry close is and using that number as the divisor?
and [0 day ago max(10,close) / 120 day ago $industry max(10,close) > 1.2 ]
Is that possible without finding what the industry close is and using that number as the divisor?
0
Best Answer
-
The short answer is no. The scan engine doesn't accommodate variables, which is what "$industry" is trying to be in that statement.
I'm wondering what you are referring to specifically when you say "industry group price".
0

Answers
-
Actually that scan line isn't quite what I was going to scan for, but the answer would be the same.
It was for stocks in an industry group (not using scan format) roughly
[(120 days ago symbol/industry) / (now symbol/ industry)] to find stocks in an industry group that have outperformed the industry for that amount of time. Not sure where I'd go from there until I see what that brings up.
Variables wouldn't be required if I could use $DJUSBT (or whatever), but that doesn't seem to work either.
But maybe I am missing something.0 -
Unfortunately, you can't scan directly for relative performance (RS).
As you've suggested, you need to compare a symbol's value for the indicator you are interested in to a constant (i.e. a plain number) that represents that indicator's value for your benchmark symbol.
You might consider using ROC(120). So for instance, today, $DJUSBT's ROC(120) is -0.58,
so your scan would be
[group is Biotechnology]
and [ROC(120) > -.58]
rank by ROC(120)
That gets 117 results.
Alternatively, you could just rank by SCTR, which is a variation of relative strength:
[group is Biotechnology]
rank by SCTR
Unfortunately, the industry indexes ($DJUSxx) don't have SCTRs. If they did, you could import the industry symbols into a list, add the index symbol to the list and run a scan to rank the list. Then save (replace) the results in rank order. Those above the index symbol would be outperforming it. Maybe using XLV, which does have a SCTR, instead of $DJUSBT would be close enough.
Just a note about the biotech group and relative strength - biotech, as I'm sure you know, is highly sensitive to news. Poorly performing stocks can suddenly take off in spite of poor RS (so you miss them), but worse, stocks doing really well can get creamed on unexpected bad news. So RS may not be as good a gauge of future performance in biotech as it can be for less volatile industries.
0 -
Thanks again.
Yeah, I could do those. I was looking at a biotech stock as I wrote; that is how it got there, but I'll bet I could find several stocks that have outperformed the industry index consistently for over a year.
I have just about every stock (price and volume limitations) for just about every Dow Jones Industry group that StockCharts uses in industry group chartlists. I also have a chartstyle I can use to see what I am looking for. I just want to learn how useful this measure might be. But it isn't a scan. Biotech wasn't quite as good as I expected, but I found 3 stocks (ABBV,AMGN,CRL) that have largely been outperforming since November. Not that I'd want to buy them.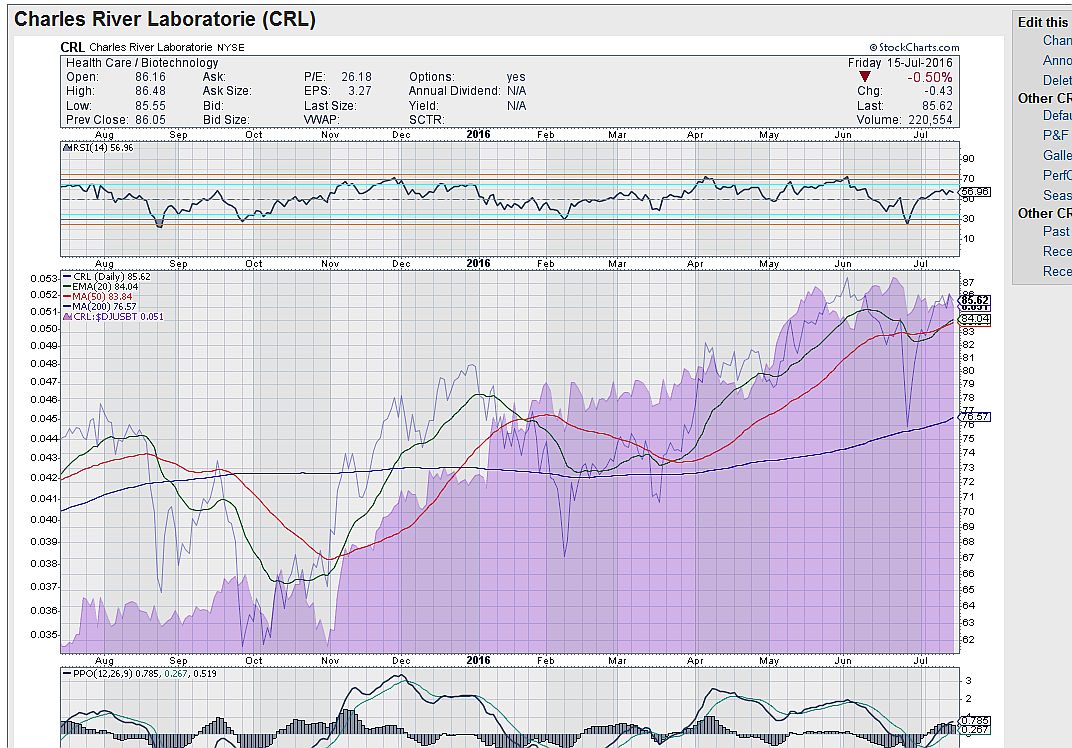 0
0
Categories
- All Categories
- 2.3K StockCharts
- 397 SharpCharts
- 146 Other Charting Tools
- 69 Saved Charts and ChartLists
- 1.5K Scanning
- 74 Data Issues
- 177 Other StockCharts Questions
- 218 Technical Analysis
- 155 Using Technical Analysis
- 2 InterMarket and International
- 19 Market and Breadth Indicators
- 42 Market Analysis
- 109 Trading
- 109 Trading Strategies
- 163 S.C.A.N the StockCharts Answer Network forum
- 65 Using this StockCharts Answer Network forum
- 98 s.c.a.n. archives
- 5 Off-Topic
- 6 The Cogitation & Rumination Emporium
- Forum Test Area