New Members: Be sure to confirm your email address by clicking on the link that was sent to your email inbox. You will not be able to post messages until you click that link.
A scan to spot strong buyer interest near 52 week lows

The recent Oracle jump made me curious about whether it was a Wyckoff accumulation.
It didn't appear to be, but, I did notice several consecutive days of strong buying in late April when the stock looked weak. I've seen this before in stocks that later perform well.
So here's a simple scan that picks up strong buying when a stock is weak enough to be trading near it's 52 week lows. Like most scans, it picks up some symbols that don't work out, but some have legs.
I haven't thoroughly researched this, and it is a bull market; almost anything will "work" in a bull market. But the logic behind it is, retail buyers generally don't buy weak stocks. They buy stocks already on the way up, or, stocks that are pulling back from new highs that look like a bargain. So that implies the buyers on weakness are "strong hands", i.e. knowledgeable institutions and funds, and several days of buying shows commitment to the story behind the stock, whatever it turns out to be. Professionals make mistakes, too, but not as many.
Run this for May 2, 2025. Oracle is just one of a number stocks that have done well since then.
// begin scan
[group is sp500] // or your choice, indexes, industries, market cap, etc.
// at some point in the last twenty days, price closed in the lowest 20 per cent of the one year range.
and [min(20, Fast Stoch %K(251,1))< 20]
// at some point in the last twenty days, there were at least 5 consecutive up closes
and [max(20, Streak Up(close)) > 4]
// end scan
That's it. Try it for other dates and see what it comes up with.
0
Comments
-
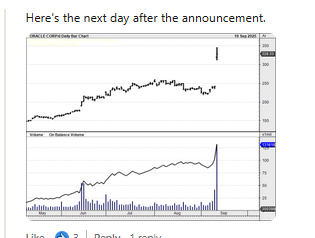
Jeremy du Plessis posted the other day on LinkedIn, about ORCL and the volume that came in the day before the September announcement. He mentions that the mid June volume looks interesting too. He showed OBV as a tip off
https://www.linkedin.com/posts/activity-7371852731545788416-7T0n?utm_source=social_share_send&utm_medium=member_desktop_web&rcm=ACoAAAFdnGEBa4OywV_iupyIx1H-ZzlQ0YP0bWY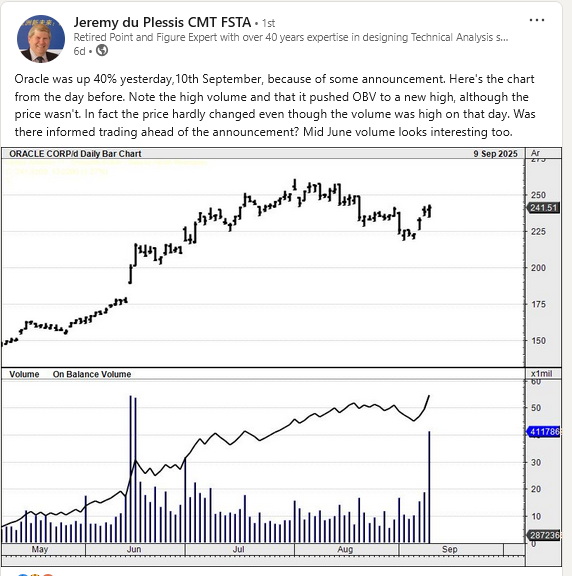
A good place to get involved with ORCL (as with most things), from a Dynamic CSS perspective, is when the longer columns of X start to outnumber the longer columns of O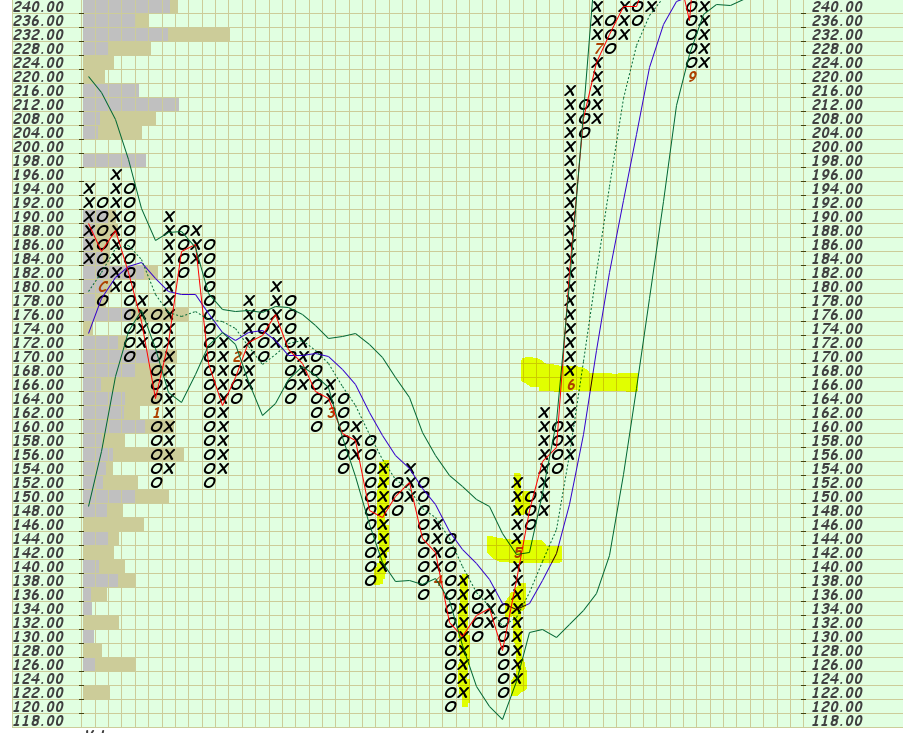
Like a lot of stocks after the markets early April bottom, a strong Low Pole Pattern was shown in April on ORCL. A second long column of X appears leading into May. When the Red line crosses above the Blue line, in May it is often a great time, from a risk perspective, to take on some risk. The Dynamic CSS Pattern is designed to look for securities changing from signficant distribution to significant accumulation. ORCL is a pretty good illustration of the pattern.
0 -
It's probably a better idea to wait for the price confirmation, a method built in your P&F approach.
You do give up those gains that lead to the signal, but there are two advantages to that - your risk of false positives is probably lower, and the trade develops sooner after entry, reduced the amount of capital you have tied up in trades taking their time to develop (or fail).
Still, the scan above has the advantage of bringing symbols to your attention early in the cycle. That gives you time to sort the wheat from the chaff and maybe get a handle on the fundamental reasons the trade might (or might not) work out.
Is it possible to tell the date on which Red x Blue? And is there a scan to catch that crossover?0 -
Unfortunately, the StockCharts.com scan engine doesn't allow you to scan on PnF Moving Averages. I put the 1 and 7 column moving average on the chart. I also put the 5 column Bollinger Band (5,3) on the chart. This is the Green lines that show on the chart. The 5 column MA is the green dashed line and the Upper and Lower Bollinger Bands show as solid Green lines. One would need to approximate where those levels lie to use time based criteria.
I'd say that the 7 column MA approximates a 20 - 50 day SMA. It depends on how quickly the pattern forms. The Month Markers on ORCL show that the 7xx part of the pattern formed within a month after the CSS, so the shorter end of the MA range would probably apply.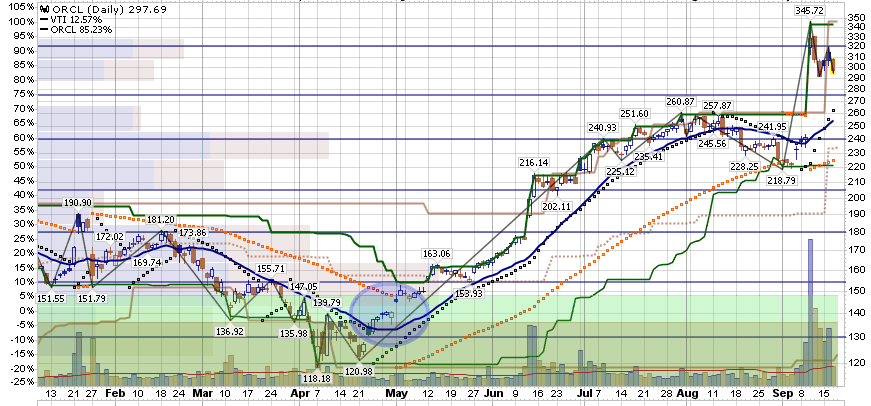
In the chart above, the darker green area is the 7xx point. The lighter greed area is the pullback on the traditional scale PnF chart. The Blue oval is the period on question on the movement.
The Green lines are 40 period Price Channel. The black and orange dots are the daily Parabolic SAR with the following settings:
As far as "giving up gains", it is a something to be aware of within any system. I espouse my analysis/ system as it has worked well for me, but there are always different/better/worse methods to use. On ORCL, if you are a trader the simple moving average 20 cross would have gotten you in around 136ish-140, and you would have been able to ride the price much higher. Your 3 period H/L MA process definitely would have signalled sooner/lower. I don't know how much lower you would be willing to take the position but anytime you can get a lower cost basis, it can't be all that bad.
I have heard the CSS Strategy called "bottom fishing, with an edge". I often find myself answering "After a Dynamic CSS Pattern" to the question "When would have been a good time to start getting involved in this security?".
I do like your scan as it does find names that are worthy of further review. Adding a PnF segment as part of that review can be beneficial, in my opinion.
0 -
Thanks for the detail. Agree with your conclusion re P&F.
Just to be clear, the H/L MA 3 is really for timing swing entries/exits once a trend is established, i.e. to get in/get out of the legs, not identifying a long term trend change on its own. On the long entry, buy inside the envelope once price has crossed (preferably closed above) the MA high; on the exit, sell inside the in envelope (if things look weak), or above the previous high, after price gets below the MA L. Vice versa for shorts. It's far from foolproof, as short parameters tend to be - more of just a guide. You need a trending, smooth trading stock for it work as intended. More erratic stocks either never give you the signal to get in, or just keep on going after an exit signal, or stop you out prematurely.0 -
"More erratic stocks either never give you the signal to get in, or just keep on going after an exit signal, or stop you out prematurely"
I hear you. I don't like erractic looking charts much at all. They require much more time in analysis, and, if you have to work at deciding if the erratic chart is good or not, it's probably not. That not means not at this moment. It needs more time to develop.
Below is a partial "nested scan" that will find something that I call a PnF Strong Low Pole. A traditional Low Pole pattern is defined as a Column of O's that exceed the prior column of O's by at least 3 boxes. Using the criteria below, that column of O's should exceed the prior column by at least 5 or more boxes. This definition falls more in line with Prashant Shah's definition of a Low Pole pattern. It provides more proof of downside movement with a longer Low Pole Column required.
Prashant Shah is a highly regarded technical analyst, author, and Co-founder and CEO of Definedge for India markets. I've recommended his PnF book previously.
In the scan lines I have a limit on the price range used for the securities selected, but you can change those to any values you'd like. You can also change the Box Count to be higher or lower.
I call this a "nested scan" as it repeats the same line of criteria, but adding a wider net using the OR statements.
So if you run this "today", it will return names that showed this criteria in the past 10 days. Change the Calendar in the Scan Workbench from a 0 to a 10 and you will pick up the prior 10 days to get securities that showed a Strong Low Pole in that period.
"Nested scans" and OR scans need very specific attention paid to the brackets [ ]. I use "nested scans" often so that I don't have to mess with the Calendar all that often and to capture more securities that met my requirements, not just today, but maybe 3 days ago, etc.
and [
[[[Close > 3] and [Close < 230]] and [[PnF Low Pole is true]
and [P&F Box Count >= 8]]]
or [[[1 days ago Close > 3] and [1 days ago Close < 230]] and [[1 days ago PnF Low Pole is true]
and [1 days ago P&F Box Count >= 8]]]
or [[[2 days ago Close > 3] and [2 days ago Close < 230]] and [[2 days ago PnF Low Pole is true]
and [2 days ago P&F Box Count >= 8]]]
or [[[3 days ago Close > 3] and [3 days ago Close < 230]] and [[3 days ago PnF Low Pole is true]
and [3 days ago P&F Box Count >= 8]]]
or [[[4 days ago Close > 3] and [4 days ago Close < 230]] and [[4 days ago PnF Low Pole is true]
and [4 days ago P&F Box Count >= 8]]]
or [[[5 days ago Close > 3] and [5 days ago Close < 230]] and [[5 days ago PnF Low Pole is true]
and [5 days ago P&F Box Count >= 8]]]
or [[[6 days ago Close > 3] and [6 days ago Close < 230]] and [[6 days ago PnF Low Pole is true]
and [6 days ago P&F Box Count >= 8]]]
or [[[7 days ago Close > 3] and [7 days ago Close < 230]] and [[7 days ago PnF Low Pole is true]
and [7 days ago P&F Box Count >= 8]]]
or [[[8 days ago Close > 3] and [8 days ago Close < 230]] and [[8 days ago PnF Low Pole is true]
and [8 days ago P&F Box Count >= 8]]]
or [[[9 days ago Close > 3] and [9 days ago Close < 230]] and [[9 days ago PnF Low Pole is true]
and [9 days ago P&F Box Count >= 8]]]
]
Low Poles are very specific PnF patterns. They require a long column of O's that is retraced in the very next column of X, at least, 50% of that column of O's. Many times that retracement doesn't occur until a few columns later. Those will not show up on this scan, but you may notice what I am talking about if you use these "'nested scan" lines.
Questions or comments always welcome.0 -
Thanks, as a bottom fisher by nature that could be fun.
I'm not experienced with P&F scanning but I wonder if you could use max and min to shorten the scan.
Would this work the same? If so, it eases the bracket counting problem.
and [min(10,close) > 3]
and [max(10,close) < 230]
and [min(10, P&F Box Count) >=8]
and [ // begin low pole 'or'
[PnF Low Pole is true]
or
[1 days ago PnF Low Pole is true]
or
...
] // end low pole 'or'0 -
When I write "nested" I tend to write fully nested lines.
This probably should work as a stand alone in that partial scan.
and [min(10,close) > 3]
and [max(10,close) < 230]
But the
and [min(10, P&F Box Count) >=8]
would be problematic. The scan is designed to find Low Pole Patterns. A Low Pole Pattern is defined using the traditional PnF pattern recognition in the scan engine. That's why the second part of the OR state is double bracketed.
and [[1 days ago PnF Low Pole is true] and [1 days ago P&F Box Count >= 8]]
A Low Pole pattern isn't a Low Pole pattern unless there is a Low Pole Column (O's exceeding prior column of O by at least 3 boxes), and the next column of X retraces, at least, 50% of the prior column of O's. As we are working with patterns, if we put the Box Count outside of the OR statement, then you will get it counting any column in the period of the "nest". That isn't what this scan is looking for.
I have other different scans that look for 6xx on lower priced securities, up to 9xx columns as we move up the share price scale. Those also need to have the Box Count and Column identification bracketed together.
[[Close >= 25]
and [PnF Chart In Xs is true]
and [P&F Box Count > 6] and [1 days ago P&F Box Count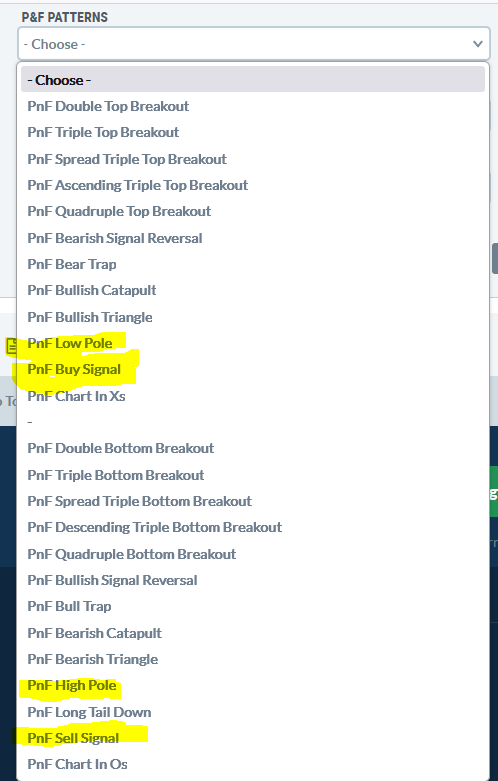
At the top of the listing are, what you would assume to be Bullish patterns and the bottom Bearish patterns.
So you can see that PnF Low Pole and PnF Buy Signal are two of the options in the Bullish side. Well, you will come up with Zero results if you scan for
and [PnF Buy Signal is true]
and [PnF Low Pole is true]
as StockCharts doesn't consider the Low Pole to be in the Bullish patterns. If you change the Buy Signal is true to is false, then you will get results. Took me a while to figure that out.
At the bottom of the listings are the PnF Sell Signal and the High Pole options. Stockcharts considers the High Pole to be a Bullish pattern. So if you were to put those two filters into a scan
and [PnF Sell Signal is true]
and [PnF High Pole is true]
You will get Zero results.
I haven't made the suggestion for them to change the classifications on the PnF stuff and don't intend to.
Once you get the nuances, it opens up a lot of base and more complex scan oppotunities.
Questions or comments always welcome.
and just an FYI, if you want to scan for all PnF Buy Signals and Low Poles you would use an OR statement
and [[PnF Buy Signal is true]
or [PnF Low Pole is true]]
0 -
I thought there might be some nuance in P&F scans, and as you pointed out, there is. Thanks!0
-
When scanning for patterns, there are always nuances. I'm going to adjust the partial scan I shared though, as that will make widening or tightening the "fishing net" easier than doing so on each line. Thanks for checking it out for me and making it better.0

Categories
- All Categories
- 2.3K StockCharts
- 397 SharpCharts
- 146 Other Charting Tools
- 69 Saved Charts and ChartLists
- 1.5K Scanning
- 74 Data Issues
- 177 Other StockCharts Questions
- 218 Technical Analysis
- 155 Using Technical Analysis
- 2 InterMarket and International
- 19 Market and Breadth Indicators
- 42 Market Analysis
- 109 Trading
- 109 Trading Strategies
- 163 S.C.A.N the StockCharts Answer Network forum
- 65 Using this StockCharts Answer Network forum
- 98 s.c.a.n. archives
- 5 Off-Topic
- 6 The Cogitation & Rumination Emporium
- Forum Test Area