Scan to find an industry group about to take off

I am trying to write a Scan to find an industry group about to take off. To do this I want to find an industry group which has recently (within the last 2 - 4 weeks) had its 10 week slow Stoch cross out of oversold and then had its price climb above the 50 dma. Below I will insert some code which I think can do this for a stock. But I am not sure how to do it for an industry group. Is there a way?
Below is the code I would use to find such a stock. How much of it can I use to find such an industry group?
and [ [1 week ago Weekly Slow Stoch %K(10,1) < 20] // or 2 week, 3 week or4 week ago?
and [0 weeks ago Weekly Slow Stoch %K(10,1) > 20 ] ] // w-KosO
and [ [Weekly Slow Stoch %K(50,1) < 20] or [Weekly Slow Stoch %K(50,1) > 80]] // K50w os, ob
and [today's Close > today's sma(50,close)] and [yesterday's Close <= yesterday's sma(50,close)]
Comments
-
In order to scan Industry Groups, you would need a chartlist with the industry groups in it to run the scan against.
Easiest way to get one is to go to the Market Analysis dropdown in the Banner at the top of the page and go to the SCTR Reports. SCTR Reports opens with LargeCap Stocks as the default. Click the dropdown and select Dow Jones US Industries.
This will give a list of the Industry Groups. Copy and past this to excel or a text document. Then copy the Symbols into a new chartlist and name it StockCharts DJ US Industries. Add this chartlist to the top of your scan to run it against that list.
While we are on the SCTR Reports page, note that there is a TimeFrame dropdown. You can select One Week and then click the CHG column to put the results in asc or des order and the highest or lowest SCTR change for the week will be at the top of the list.
Next door to the SCTR Report is Index Members, and you can do similar TimeFrame views of many different Index and Sector memberships.
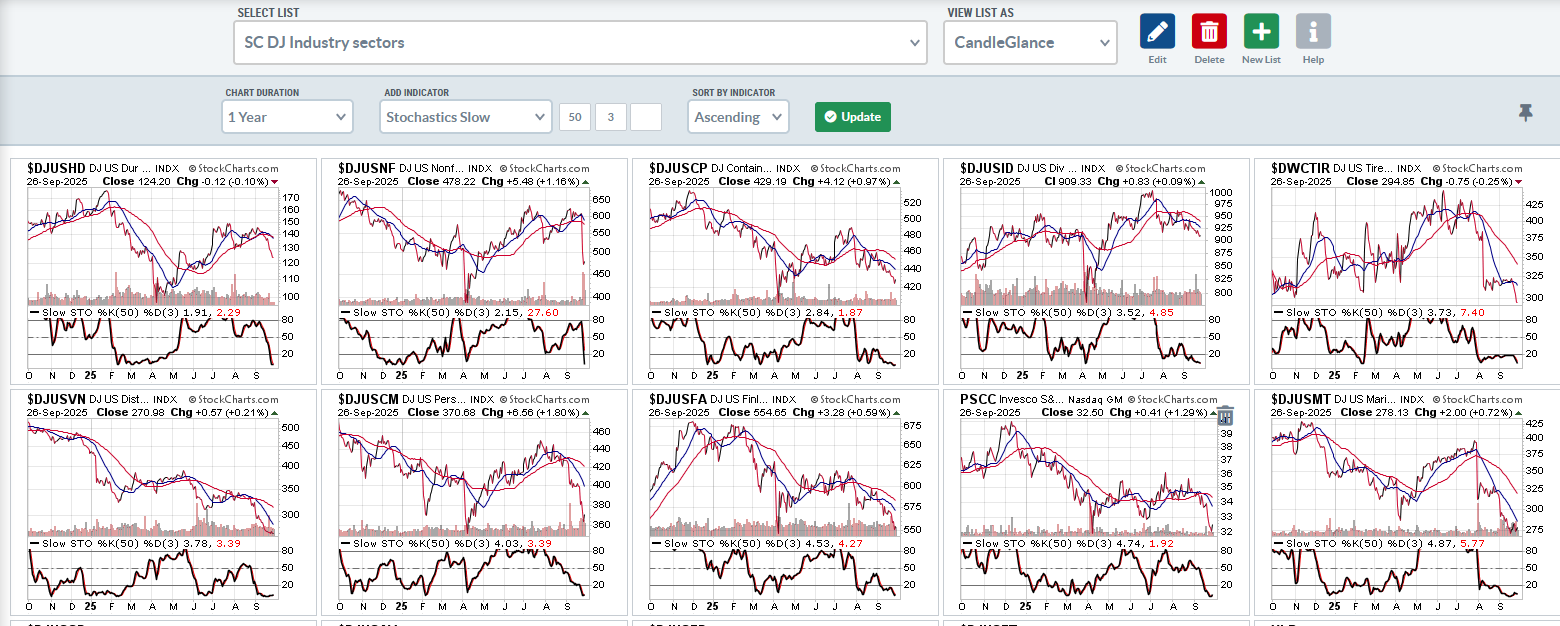
Once you have the industry groups in a list you can view in Summary View and then number them by an available timeframe period there. Or you can view the list in CandleGlance view and sort that view by an Indicator. Review the charts to see what you may be looking for.
Or run your scan against the The SP500, SP400, and SP600, as that is the group that is in the actual industry groups for the most part. If you notice a bunch of names from the same industry group, it probably means that group is behaving similarly.
I just ran your scan against that and only 2 names resulted. DUOL (Software) and AESI (Oil Equip). If I take out the 3rd line about weekly Slow Stoch(50,1)…. I get 3 additional names with no repeats in the Industry Groups
0 -
Looking at the scan code lines, it appear you are looking for an Industry Group where the Weekly Slow Stoch 10 crosses above 20 and the Weekly Slow Stoch 50 is either OS or is OB, and the daily close is crossing above the daily SMA50.
and [ [1 week ago Weekly Slow Stoch %K(10,1) < 20] // or 2 week, 3 week or4 week ago?
and [0 weeks ago Weekly Slow Stoch %K(10,1) > 20 ] ] // w-KosO
and [ [Weekly Slow Stoch %K(50,1) < 20] or [Weekly Slow Stoch %K(50,1) > 80]] // K50w os, ob
and [today's Close > today's sma(50,close)] and [yesterday's Close <= yesterday's sma(50,close)]
I would question why the wSS 50 needs to be OS or OB? This will give you names that are still languishing (OS) on the year, or Ones that have broken out and are, or close to, making new highs (OB) for the year.
Maybe putting that requirement into the >20 < 80 range would provide a better indication of a basing and/or rising out of basing name.
Also, you are looking at a current daily cross above SMA with current weekly criteria in the other lines. This could/will produce some undesirable results as the weekly bars are not complete until the end of a week and the daily bar is complete at the end of each day. So you will get hits EOD today that may not be true by the end of the week. It's also ONLY good on the day of the cross and is no longer valid a day later, or a week later. I think it might be too tight of a restriction, but that is just my opinion. If I run the scan using the >20 < 80 and removing the SMA cross requirement, I get one industry group today $DJUSRU, the Restaurants and Bars Index. And 19 names from the SP1500, but no bars or restaurants.
0 -
Imkwin, thank you for the great analysis in both of these posts. It was all most helpful. I followed all of your advice to get a new chartlist with the 104 DJUS industries in it.
So, for now, I think I want to focus on finding stocks which meet these standards. I have tweeked that code (following your advice and added a few more safeguards) and have made it an alert. I have switch to all daily (no weekly indicators) and left out the SS K50w completely. I have also tried to let the SS K50d cross take place any time in last 10 days and have limited the price cross over its 50dma to today.
I have put that code below. How close to my target am I?
// s, K50d oso, Out of Red (price > 50 dma) -- Skor
[type is stock] and [sma(20,volume) > 3000000] and [close > 5] and [country is US]
// and [group is Internet]
and [min(15, Slow Stoch %K(50,1) ) < 20] // K50 has been OS in past 15 days
and [min(10, Slow Stoch %K(50,1) ) > 20] // K50 has broken out in past 10 days
and [today's Close > today's sma(50,close)] and [yesterday's Close <= yesterday's sma(50,close)] // today price xa 50dma
// end alert
0 -
Looks like it matches your desire with one exception. The min lines have overlap. The 2nd line requires the SSk50 to be greater than 20 for the last 10 days. The min 10 is > 20
I think you may want to change the second min to Max. See how that changes your results.
0 -
That is a good catch. I have very little experience with min and max. Thanks for your help. I will make that change.
0 -
@BobS, that's the nice thing about having this forum. We can get help, bounce ideas off each other, and give help or input when we can. I've learned a lot from this forum over the years, I try to return the favor when possible. Min and Max are great filters to use in appropriate situations. I use them in many of my scans.
Just an FYI, the Industry Groups now have SCTR ratings as well. These will show in Summary View (if you have the SCTR column showing) as well as on the Full Quote of the SharpChart. You can also use the industry SCTR filter in the scan workbench.
and [SCTR.industry >50] for example.
This only filters Industry Group symbols in your Industry Group ChartList.
0 -
@Imkwin, thanks so much for the help and the encouragement to help others as well.
0


Categories
- All Categories
- 2.3K StockCharts
- 395 SharpCharts
- 146 Other Charting Tools
- 69 Saved Charts and ChartLists
- 1.5K Scanning
- 74 Data Issues
- 177 Other StockCharts Questions
- 218 Technical Analysis
- 155 Using Technical Analysis
- 2 InterMarket and International
- 19 Market and Breadth Indicators
- 42 Market Analysis
- 109 Trading
- 109 Trading Strategies
- 163 S.C.A.N the StockCharts Answer Network forum
- 65 Using this StockCharts Answer Network forum
- 98 s.c.a.n. archives
- 5 Off-Topic
- 6 The Cogitation & Rumination Emporium
- Forum Test Area