New Members: Be sure to confirm your email address by clicking on the link that was sent to your email inbox. You will not be able to post messages until you click that link.
S&P 500 stocks and their performance

Jccj
✭
Does anyone know how to show all the S&P500 individual stocks performances going back in time(specific dates) for example from 1/1/2025 to 01/31/2025 and from 2/1/2025 to 2/28/2025 and so on. thanks
0
Comments
-
One possible option
You have a list of SP500 stocks and then run a scan on the list and the only criteria in the scan is a Rank by ROC(whatever period you are interested in). Then you would offset the date of the scan using the Calendar function.
Most months have 20-22 trading days but this example uses ROC20. You can adjust the ROC period for each month's trading days if desired.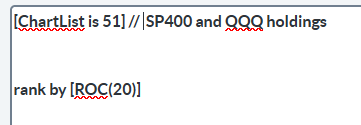
To offset the scan, click on the number in the Starting field and a calendar will appear. Select your starting date you want to run the scan.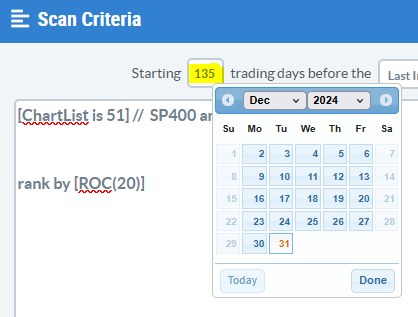
Your results page will have the Rank by data in the last column.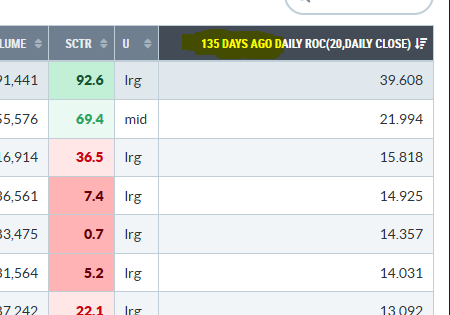
ROC is just one option. PctChange and PctDiff, probably would work as well.
0 -
I could count the trading days to January 1 2025.(lets say it is 135 days) but how could I put the end date as 1/31/2025 to get the performance of all 500 stocks for the month of January 2025.otherwise it will calculate from the date I put to the current date. thanks
0 -
Sorry, my bad technical writing.
The ROC value, ROC(20) in the example, is your number of Market days in the month.
You'd pick the month ending date on the calendar for the month you want and you would change the ROC value would be the number of Market days in that month.
For example, you'd figure out how many market days in May and make that your ROC value. Then you'd select May 31 on the calendar and run the rank by scan for May to get your performance for the month.
0

Categories
- All Categories
- 2.4K StockCharts
- 397 SharpCharts
- 146 Other Charting Tools
- 69 Saved Charts and ChartLists
- 1.5K Scanning
- 74 Data Issues
- 177 Other StockCharts Questions
- 218 Technical Analysis
- 155 Using Technical Analysis
- 2 InterMarket and International
- 19 Market and Breadth Indicators
- 42 Market Analysis
- 109 Trading
- 109 Trading Strategies
- 162 S.C.A.N the StockCharts Answer Network forum
- 64 Using this StockCharts Answer Network forum
- 98 s.c.a.n. archives
- 5 Off-Topic
- 6 The Cogitation & Rumination Emporium
- Forum Test Area