New Members: Be sure to confirm your email address by clicking on the link that was sent to your email inbox. You will not be able to post messages until you click that link.
percentage decline from 52 week highs

Best Answer
-
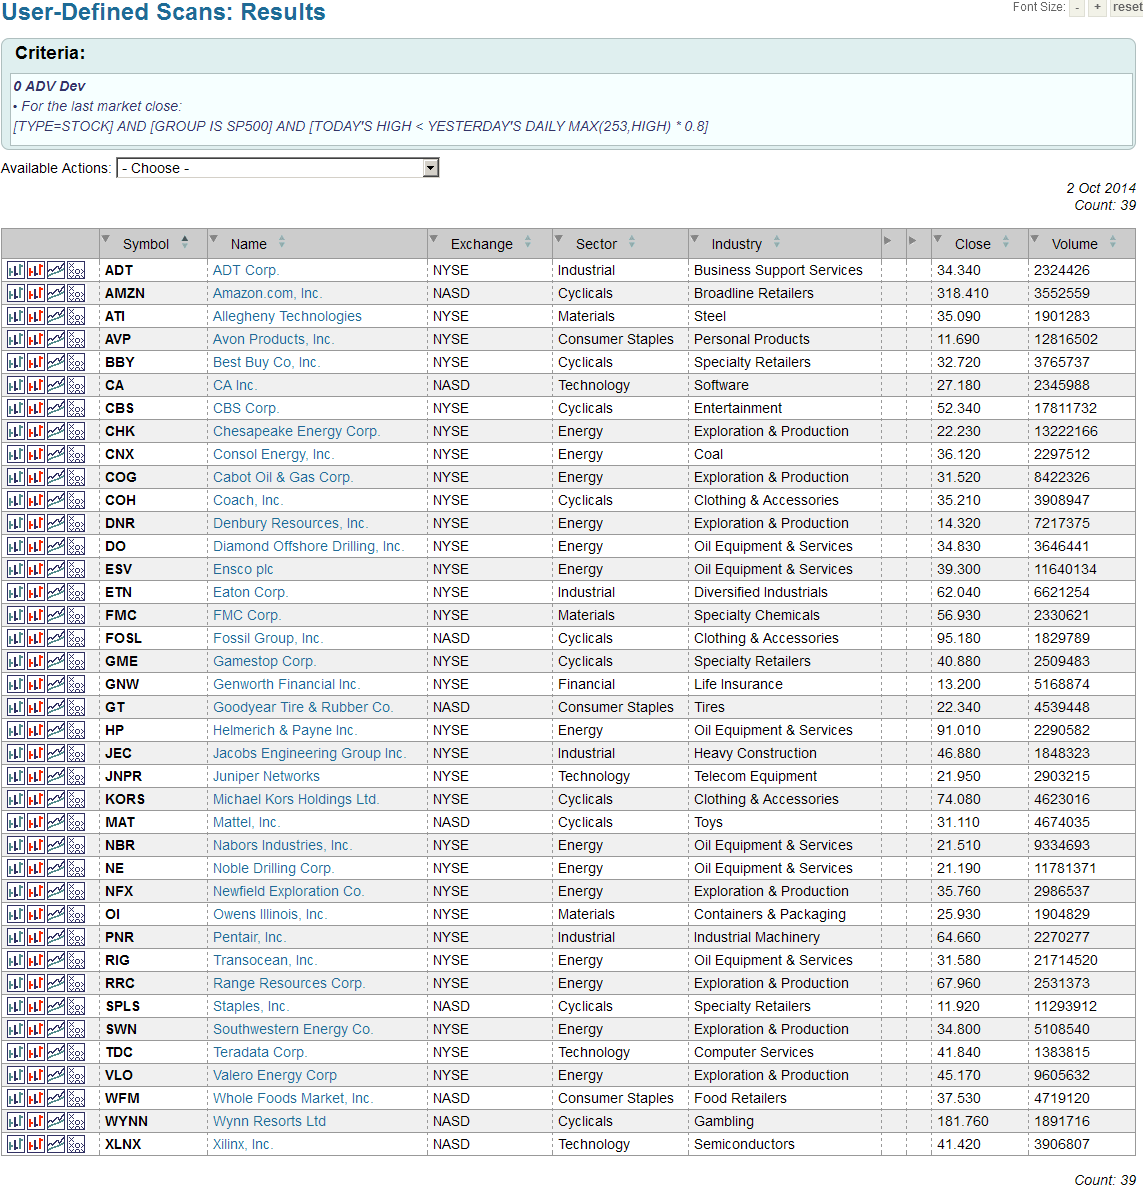
Here's a couple of screen shots of the scan I ran and the results page. I ran it after the close today and got 39 hits. A quick check of the charts and yes they all seem to meet the requirement that the current close was at least 20% below the max high which could have happened any time during the last year.

0

Answers
-
Welcome to the forum Sandy. First recommendation is to read the information on scanning which can be found under the ChartSchool tab on the main StockCharts site. There are also lots of how to examples there.
http://stockcharts.com/school/doku.php?id=chart_school:scanning
To help jump start you in the right direction, just use the drop down menus in the advanced scan workbench. Delete the default criteria then select and insert type is stock and group is S&P500, thats the first part.
[type = Stock]
and [ group is SP500 ]
Now select predefined scans and insert new 52 week high.
and [today's high > yesterday's daily max(253,high)]
So notice that this predefined scan code looks for todays high to be greater than the highest high over the previous 253 days (thats 52 weeks of trading days). So lets just switch this around a little.
You want todays high to be at least 20% less than the value of the max high over the previous 52 weeks (253 trading days). Note 20% less is the same as multiplying a value by 0.8 and we want todays high to be less than not greater than.
and [today's high < yesterday's daily max(253,high) * 0.8 ]
Hope this gives you some new ideas.
0 -
In order to determine the percentage decline from 52 week highs on the S&P 500, I used the following criteria: [type=stock] and [group is SP500] and [ today's high > yesterday's daily max(253,high)] and [today's high< yesterday's daily max(253,high) * 0.8]
As my result was a zero count, I'd appreciate any suggestions
leading to a definitive answer.0 -
Sorry Sandy, by switching things around a little on a standard scan, I didn't mean include both clauses in the scan. IE you can't look for a 52 week high and also look for a 20% decline from a 52 week high all in the same scan, nothing will meet both. I was just trying to show you how to modify a clause to do what you needed.
Your scan should look like this.
[type=stock]
and [group is SP500]
and [today's high< yesterday's daily max(253,high) * 0.8]
let us know how it works0 -
That did not work. My kids are visiting next week and I'll have them show me how to attach things and submit them for suggestions. I'll sign off for now.0
Categories
- All Categories
- 2.4K StockCharts
- 397 SharpCharts
- 146 Other Charting Tools
- 69 Saved Charts and ChartLists
- 1.5K Scanning
- 74 Data Issues
- 177 Other StockCharts Questions
- 218 Technical Analysis
- 155 Using Technical Analysis
- 2 InterMarket and International
- 19 Market and Breadth Indicators
- 42 Market Analysis
- 109 Trading
- 109 Trading Strategies
- 162 S.C.A.N the StockCharts Answer Network forum
- 64 Using this StockCharts Answer Network forum
- 98 s.c.a.n. archives
- 5 Off-Topic
- 6 The Cogitation & Rumination Emporium
- Forum Test Area