New Members: Be sure to confirm your email address by clicking on the link that was sent to your email inbox. You will not be able to post messages until you click that link.
re Candleglance drilldown chartstyle

I use Candleglance a lot to scan lists of stocks. When I see one that's interesting, I click on it to drill down to details. I'm not happy with the chartstyle that I find when I drill down. How do I save another chartstyle so it appears when I want to drill down from a Candleglance display?
0
Answers
-
If I understand what your are asking, this is what happens and what you can do.
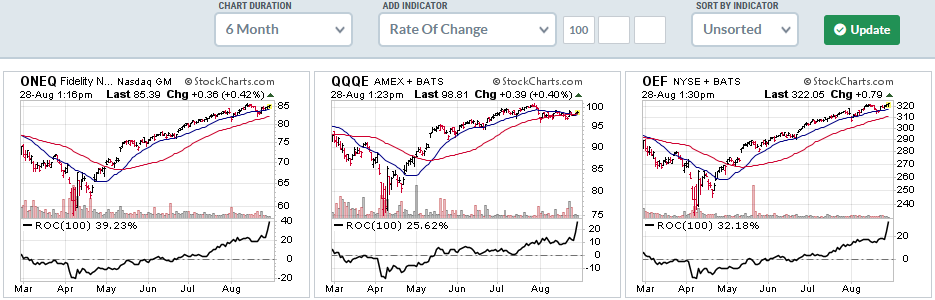
Click on a list in Candleglance and you see all the symbols on that list displayed in miniature on the page (you can customize the chart style that displays in miniature - the Candleglance style - see the link at the bottom of the Candleglance page to see how).
When you click on any chart in Candleglance view, it brings you to the Chart Workbench and displays that symbol in the Default style.
If you don't like the current default style, you can select another one or make your own and save it as the Default.
To select a pre-existing style, click on 'Select Library', click on Popular Chartstyles, or any other option, and select one. The chart will appear in the selected style. Find one you like, then click on 'Set as default'.
To make your own custom style, you can start from scratch, or select an existing style you mostly like and make changes to it. To modify a chart, click on 'Chart Settings' and make any modifications you like until you are happy. Name it and save it. Then click on 'Set as default'. (note: different pre-set styles may limit modifications available).
You can make a large number of custom chart styles ( I forget the limit) and switch between them as default any time you want.0 -
On the New SharpChart workbench they moved a few commonly used Classic chart settings locations

Save as Default, Add New, Replace
On the New SharpCharts workbench,
at the bottom of the chart are a few options dealing with Saving ChartStyles as well as setting a ChartStyle as your "default" chartstyle.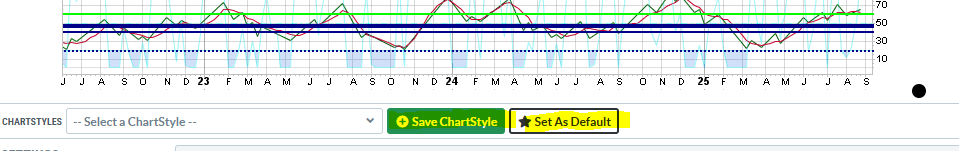
You can click on the Set as Default. This will save the chartstyle that you have on the screen as your default. Even if you are just experimenting with the settings and choose not to Save the chart as a Named (you give it a name) chartstyle. It will now appear as the default chartstyle for new chartlists, scan results, and clicking on the CandleGlance chart. So Set as Default is the way to just set, the chart on the screen, as the default.
You can also Save ChartStyle. Clicking this button opens a dialog box for you to Name it and Save New ChartStyle. You can set it as default by clicking the Star.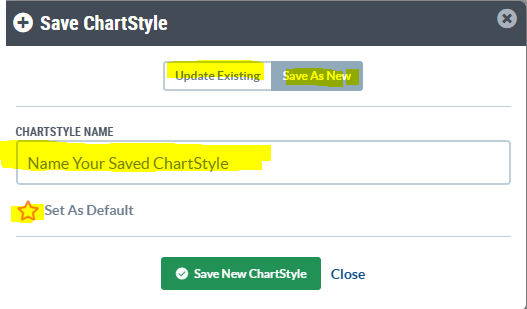
You can also Update Existing chartstyles you have saved already by clicking the Update Existing tab.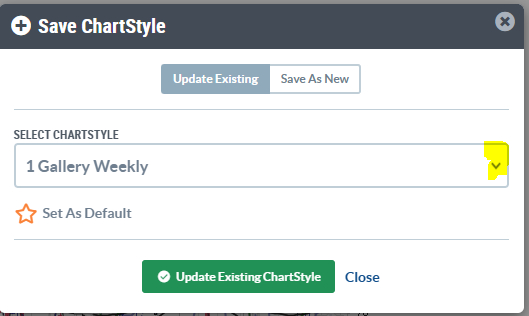
This changes the screen to a Dropdown that you can select one of your existing save chartstyles to update with the current settings with the settings of the chart on your screen. Set as Default is also available here.
You will note that the current Default chart, if you have one, is also listed in your Existing chartstyles dropdown.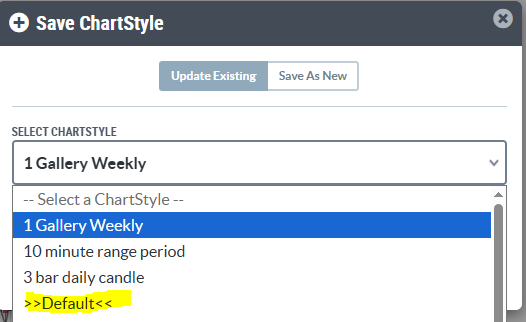
Edit Properties, Delete
To change the properties of a chartstyle name you would use the CHARTSTYLES dropdown
and then move your cursor over the name and a pencil, trashcan, and star will appear.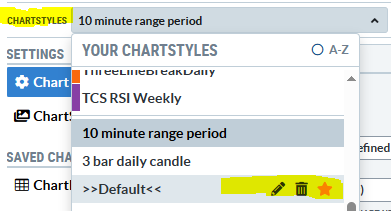
The pencil will let you Change the Name. Trashcan will let you delete the saved chartstyle and Star to set as default.
To Add the chartstyles as little Style Buttons that appear on the left side of the chart, you would click the little plus sign under the GEAR icon in the upper left margin of the chart.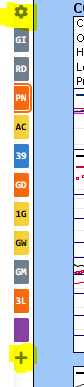
To edit the Style Buttons click on the gear icon and then use the pencil on the button to change your button.
To remove a button, change the Number in the Position box to the first option "--". Or click the Clear StyleButton #x button.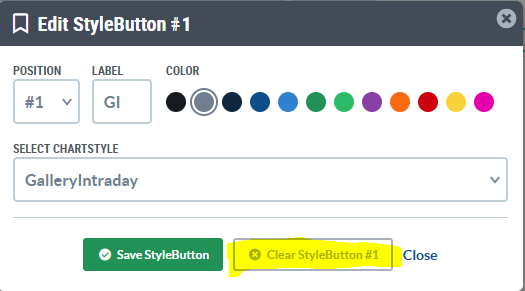
It takes a little getting used to and a few more clicks in some situations but the New Workbench is the future.
0 -
"StockCharts members can customize the settings and indicators used for CandleGlance charts by creating a ChartStyle with a specific name. If your account has a ChartStyle named CandleGlance, it will be used instead of the default style when displaying CandleGlance charts.
To change how charts on the CandleGlance page look, create a chart with your preferred CandleGlance settings. Then save it as a ChartStyle named CandleGlance. If you visit the CandleGlance page, you should see your new settings/indicators on the charts."0 -
Hmmm... None of these works! I have lots of chartstyles. But what comes up when I click a CandleGlance mini is a chart I have stopped using. When I pick the one I want and save it as Default and/or CandleGlance, it STILL doesn't come up...0
-
Could be a browser cache problem.
Close out of Stockcharts and close everything else you might have open except your browser. Find your cache and clear it. Shut down, restart, go back to SC and try again.
In Firefox the cache is under Options - Privacy and Security - Cookies and site data. Other browsers probably have something similar.0 -
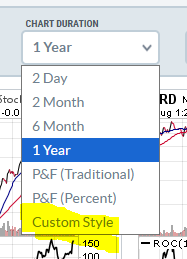
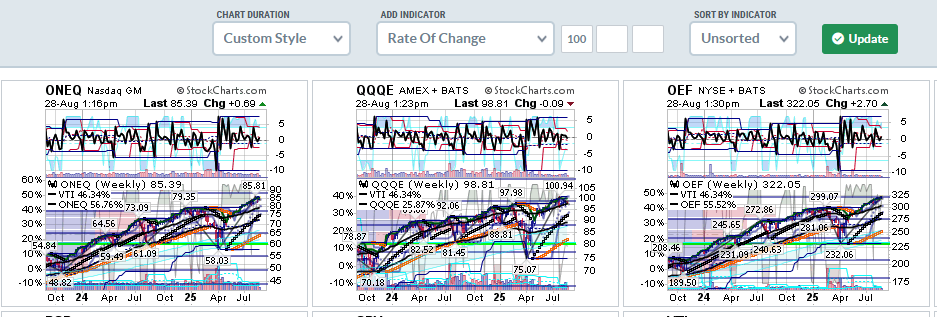
You have the ability to create a custom CandleGlance Style chart. In CandleGlance View, if you click the dropdown for Duration, it will list out the options you have to select. If you have created a chartstyle and named that chartstyle CandleGlance, then selecting Custom from the list will display your CandleGlance custom chart.
When you click on the CandleGlance chart in CandleGlance view it will open the symbol in the SharpCharts workbench showing your "default" style SharpChart. You should be able to see your selected "default" chartstyle by clicking on the ChartStyles dropdown there and the name "default" should be listed there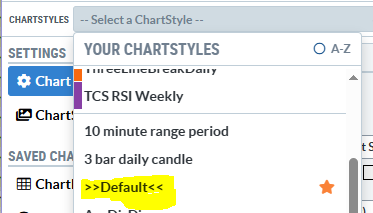
Fun Fact - a year or so ago, I had 2 "default" listings there. I deleted them both and then reselected my "default" and have been single "default" ever since.
0 -
Okay! Thank you, all! I finally figured it out! you click on a Candleglance mini chart, you get whatever you've selected FOR THAT CANDLEGLANCE LIST. I tried some other lists in CandleGlance and got the style I wanted. Back to the one giving me trouble, and it's still giving me trouble. Tried a difference list, got a different style. Went back to the one bothering me, called up the style I wanted, selected it as the style FOR THAT LIST, and VOILA! That did the trick! So the "CandleGlance" style determines what you see as default in the CandleGlance display of minicharts. But, when you click on one of the minis, what you see is what you selected (or what the default is) as the style for all the charts IN THAT LIST. Thank you again! It takes a community to raise a chart...0
-
I think you have it figured out an often confusing subject. I'll go into an old chartlist I haven't looked at in a while and it has a chartstyle that I no longer use, much less have as an option anymore in my account.
And just to throw another option available, you don't have to have ALL the charts in a list be the same style.
Easiest way to explain is if you go to Edit view and then Select one or more or Select All and then click the Maroon button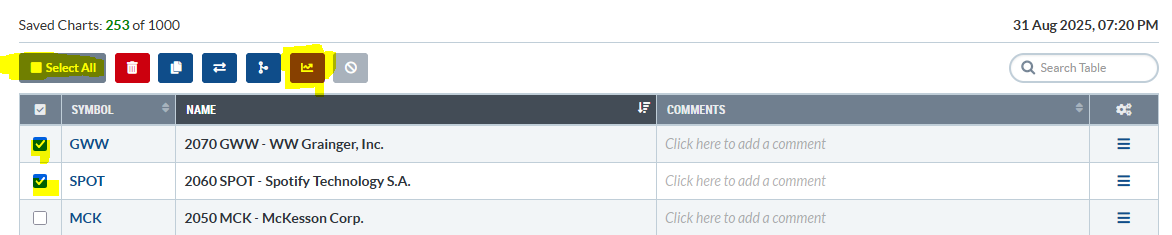
A window pops up that allows you to Select a Chartstyle from your chartstyles list to apply to the selected charts in the list.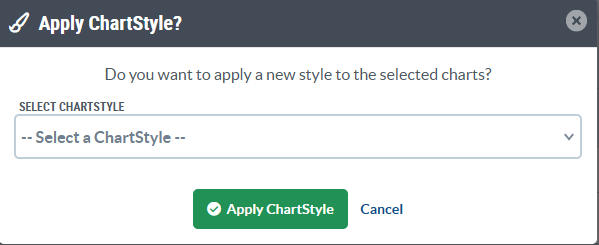
I use this sometimes by adding the same symbol in twice to a list and apply a weekly chartstyle to the 1st instance of each and a Monthly chartstyle to the 2nd so that I can view the list as weekly and monthly chart for each symbol.
"So the "CandleGlance" style determines what you see as default in the CandleGlance display of minicharts"
6 different CHART DURATION options in the dropdown to view the CandleGlance minicharts plus you can create your own Custom Style if you chose to add one. When you view in CandleGlance it usually will display in the most recent chart duration that you had selected.
0 -
My bad then on saying you get the default on clicking the mini Candleglance chart. I assumed that because I keep all my (periodically refreshed) lists in my default style. Sorry for any confusion.0


Categories
- All Categories
- 2.4K StockCharts
- 397 SharpCharts
- 146 Other Charting Tools
- 69 Saved Charts and ChartLists
- 1.5K Scanning
- 74 Data Issues
- 177 Other StockCharts Questions
- 218 Technical Analysis
- 155 Using Technical Analysis
- 2 InterMarket and International
- 19 Market and Breadth Indicators
- 42 Market Analysis
- 109 Trading
- 109 Trading Strategies
- 162 S.C.A.N the StockCharts Answer Network forum
- 64 Using this StockCharts Answer Network forum
- 98 s.c.a.n. archives
- 5 Off-Topic
- 6 The Cogitation & Rumination Emporium
- Forum Test Area