Another Wyckoff candidate

Here's one that shows dramatic accumulation without price rise, a hallmark of Wyckoff situations.
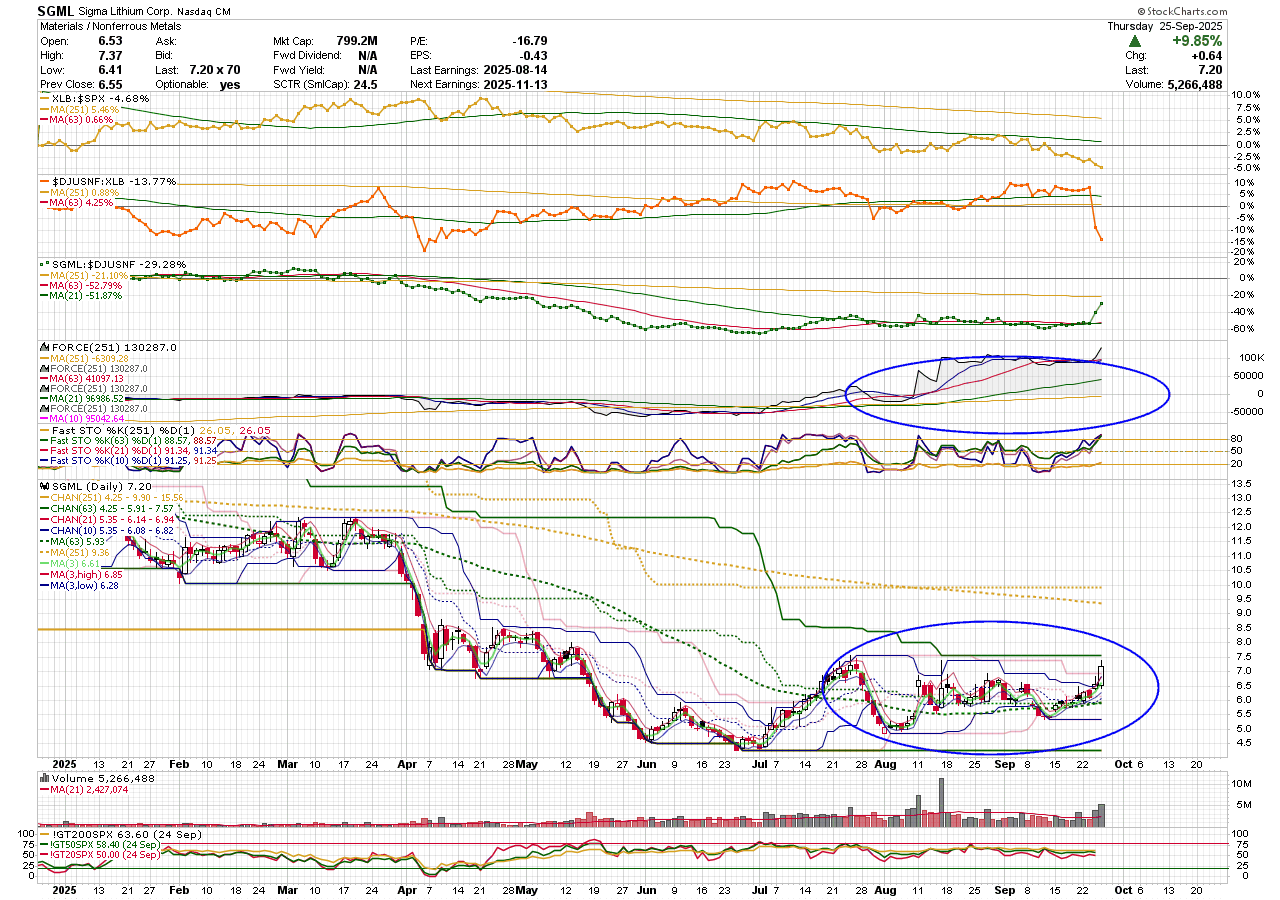
note: although there appears to be "streak up" in July, the bottom fishing scan in a previous post ( "A scan to spot strong buyer interest near 52 week lows" ) doesn't pick it up because it contains a couple of equal closes that interrupt the streak. Unfortunate.
Comments
-
That Scan won't pick it up because SGML is not in the SP500 as well as the Streak Up issue with the black candles you mentioned. SGML does show a WEEKLY Streak Up 4 in July but not on the Daily.0
-
I should have mentioned that I did adjust the scan to [group is NonferrousMetals] from [group is sp500]. Sorry to mislead.
Thanks for the tip on the weekly.
0 -
In the note below the SGML chart above, I remarked that the bottom fishing scan in a previous post did not pick it up because some of the "streak" closes were equal to the previous close, not "up".
So here's a "hack" to get around that. I say "hack" because it might not get everything, either. There's no guarantee highs or lows will be more consistent than closes. But you get more chances. This version picks up what could be accumulation in SGML on July 18.
The hack is to test for a streak of highs or lows in addition to closes.
[group is NonferrousMetals]
and [min(20,Fast Stoch %K(251,1)) < 20] // stock is near low of 52 week range
and
[
[max(20,Streak Up(high)) > 4] // 5 or more consecutive days of buying.
or
[max(20,Streak Up(close)) > 4]
or
[max(20,Streak Up(low)) > 4]]
and [max(20,volume) > max(20, sma(20,volume))] // volume is meaningful0

Categories
- All Categories
- 2.4K StockCharts
- 397 SharpCharts
- 146 Other Charting Tools
- 69 Saved Charts and ChartLists
- 1.5K Scanning
- 74 Data Issues
- 177 Other StockCharts Questions
- 218 Technical Analysis
- 155 Using Technical Analysis
- 2 InterMarket and International
- 19 Market and Breadth Indicators
- 42 Market Analysis
- 109 Trading
- 109 Trading Strategies
- 162 S.C.A.N the StockCharts Answer Network forum
- 64 Using this StockCharts Answer Network forum
- 98 s.c.a.n. archives
- 5 Off-Topic
- 6 The Cogitation & Rumination Emporium
- Forum Test Area