New Members: Be sure to confirm your email address by clicking on the link that was sent to your email inbox. You will not be able to post messages until you click that link.
How do I scan for a MACD signal line cross ?

in Scanning
What is the scan code to scan for a simple MACD signal cross? (12,26,9)
0
Answers
-
THC recently had a MACD signal line cross (12,26,9) on 11/21or24 that was not picked up by the predefined scan. I'm not exactly sure why. Could you please help me with scan code that would have picked it up ? Thanks0
-

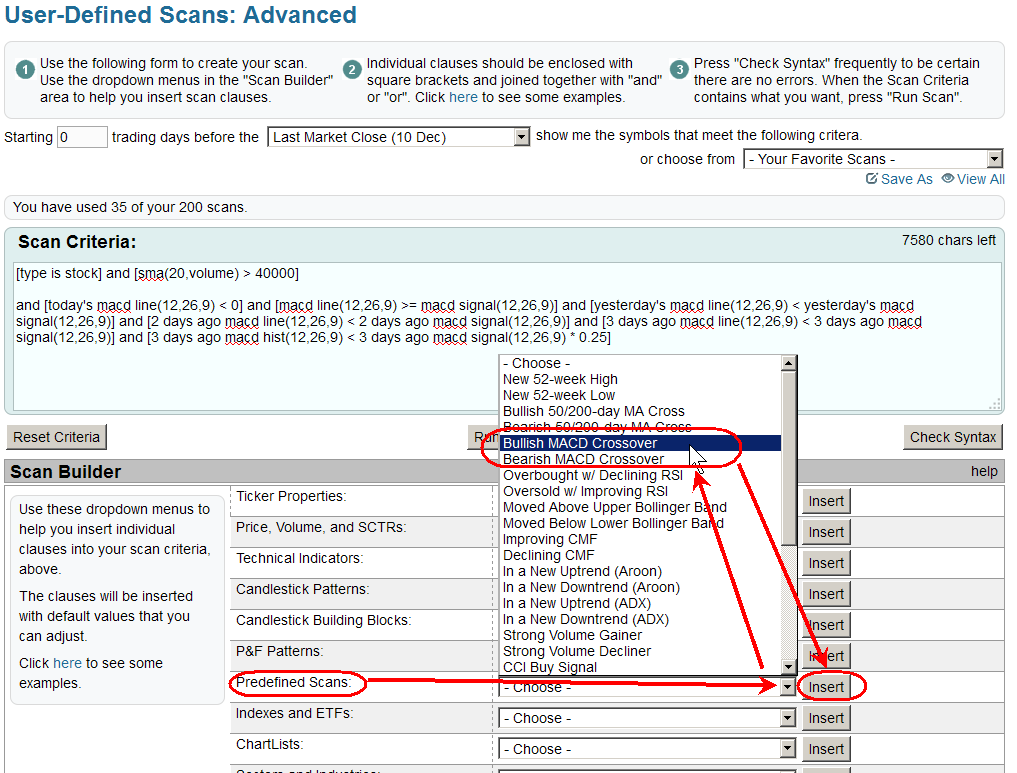
Change the last line of the scan as circled. You will be much happier camper.0 -
Sierragrande, I think this one requires just a little more explanation which should help yourself and other users in the future who might read this thread.
Note the predefined Bullish MACD crossover looks for significant events, which is why it contains a few extra criteria.
For starters the simplest MACD crossover would be the following and it would have picked up THC Tenet Health Care. However it would also pick up any crossovers in commodities, mutual funds and indexes.
[macd line(12,26,9) X macd signal(12,26,9)]
So here is the predefined scan which I have added comment lines to explain each section.
// limit output to just stocks
[type is stock]
// minimum volume
and [sma(20,volume) > 40000]
// crossover happens below the 0 line
and [today's macd line(12,26,9) < 0]
// MACD line today is "equal to or above" MACD signal line today
and [macd line(12,26,9) >= macd signal(12,26,9)]
// 1 day ago MACD line is below MACD signal 1 day ago
and [yesterday's macd line(12,26,9) < yesterday's macd signal(12,26,9)]
// 2 days ago MACD line is below MACD signal 2 days ago
and [2 days ago macd line(12,26,9) < 2 days ago macd signal(12,26,9)]
// 3 days ago MACD line is below MACD signal 3 days ago
and [3 days ago macd line(12,26,9) < 3 days ago macd signal(12,26,9)]
// 3 days ago MACD Hist is below MACD signal * 0.25 3 days ago
and [3 days ago macd hist(12,26,9) < 3 days ago macd signal(12,26,9) * 0.25]
Your stock in question THC met all the requirements except for the last one. This last criteria requires that there be some separation between the MACD line and signal 3 days ago, this ensures the crossover is more significant and not just a period where the line and signal are bouncing around very close to each other.
If you change the last line from < to >, you are now requiring the line and signal to be close together and you will pick up only those types of stocks. All others with more separation would be eliminated. It would be better to not use the last line and just review the charts of all crossovers to visually find what interests you.
Note this last line has confused many people in the past, it all depends on how your mind thinks. The last line could also have been written as follows, which might make more sense to some people.
and [3 days ago macd line(12,26,9) < 3 days ago macd signal(12,26,9) * 1.25]
Here's an article which goes thru the details of a bearish MACD crossover in much more detail, its the same as the bullish one just reversed.
http://stockcharts.com/articles/scanning/2014/01/whats-wrong-with-this-scan-bearish-macd-crossover.html0


Categories
- All Categories
- 2.3K StockCharts
- 395 SharpCharts
- 146 Other Charting Tools
- 69 Saved Charts and ChartLists
- 1.5K Scanning
- 74 Data Issues
- 177 Other StockCharts Questions
- 218 Technical Analysis
- 155 Using Technical Analysis
- 2 InterMarket and International
- 19 Market and Breadth Indicators
- 42 Market Analysis
- 109 Trading
- 109 Trading Strategies
- 163 S.C.A.N the StockCharts Answer Network forum
- 65 Using this StockCharts Answer Network forum
- 98 s.c.a.n. archives
- 5 Off-Topic
- 6 The Cogitation & Rumination Emporium
- Forum Test Area