New Members: Be sure to confirm your email address by clicking on the link that was sent to your email inbox. You will not be able to post messages until you click that link.
Getting number of days since event

Best Answers
-
You have to do it the other way around. As Gord noted, the scan engine only returns symbols. It doesn't return numbers. So you have to select the number, then see how many symbols fit that criteria.
So for instance:
and [20 days ago close = max(251, close)]
This would get stocks that made their highest close in the last year twenty days ago. Substitute high for close if that's what you want.
Note: (251 market days in a year, except for unusual circumstances that close the exchange)
So, if you wanted to do every day, that would be 251 scans. Alternatively, you could scan for highest weekly high - only 52 scans.
Another alternative - scan for a range of dates:
and [20 days ago max(10, high) = max(251, high)]
This would pick up stocks that made their highest high for most recent 251 days between 20 and 30 days ago.
0 -
If you can use the "high" instead of the "close", then I have another solution for you.
The aroon indicator oscillates between 100 and 0. Aroon is 100 when a new high is set for the period, then it decreases each day a new high is not set. To keep it simple lets use Aroon (100) ie looking for new highs during the last 100 days.
If a new high is set today Aroon 100 will be 100, if a new high is set the next day Aroon will still be 100, if a new high is not set then Aroon will decrease by 1 for each day a new high is not set. It will reach 0 if now new highs are set for 100 days.
So lets put this in a scan of our list using the "rank by" feature. Note "Rank by [ Aroon(100) ] " will give us an output of 100 for stocks that hit a new high today. So to invert it I will just subtract the value from 100. That will give us an output of 0 days ago for stocks that hit a new high today and 100 for stocks that have not had a new 100 day high in the last 100 days or more.
[favorites list is 55] // = 12 Comd
rank by [Aroon Up(100) - 100]
http://stockcharts.com/articles/mailbag/2014/06/ranking-a-group-of-stocks-by-percent-change.html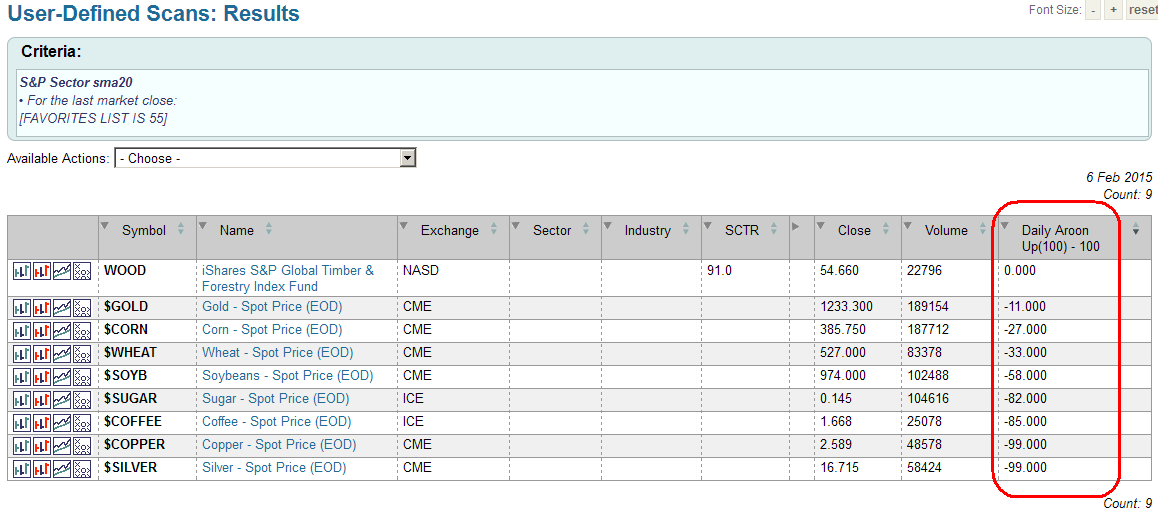
hope this gives you some other ideas.
cheers Gord
0


Answers
-
Can you explain your scan a little further. The scan engine is designed to return a list of stocks that meet certain tech criteria today or yesterday or within a few days. It can't return the number of days since a tech criteria happened.
Gives us a little more info and maybe someone can figure something out that will work for you.0 -
Thanks for your interest. The main part of the formula I'm trying to get to is basically:
Number of preceding days to search - Days since last highest close (within date range)
For example, for the last year:
360 - Days since highest close within the past 360 days
Thanks, again.0 -
Thanks, much - I think I have it.0
-
Hi Gord, terrific solution.
I ran this on Sunday, 2/8/15:
[symbol is "IBM"]
rank by [Aroon Up(251) -100]
The result was -82.869
I wonder what accounts for the fractional result? Does something funky happen with large parameters?
Also, it appears from the chart that the highest high in the past 251 days was in April, not October (which was about 80 days ago). I don't use Aroon, so maybe there is some subtlety I am missing.0 -
I picked Aroon 100 for the example because the decay From 100 to 0 is 1 point per day over the 100 day period. If we use Aroon 251 then the decay per day is 100/251 = 0.3984 or it takes 2.51 days to drop one point.

So we just need to adjust for the 251 period.
[symbol is "IBM"]
rank by [Aroon Up(251) -100 * 251 / 100]
0
Categories
- All Categories
- 2.3K StockCharts
- 397 SharpCharts
- 146 Other Charting Tools
- 69 Saved Charts and ChartLists
- 1.5K Scanning
- 74 Data Issues
- 177 Other StockCharts Questions
- 218 Technical Analysis
- 155 Using Technical Analysis
- 2 InterMarket and International
- 19 Market and Breadth Indicators
- 42 Market Analysis
- 109 Trading
- 109 Trading Strategies
- 163 S.C.A.N the StockCharts Answer Network forum
- 65 Using this StockCharts Answer Network forum
- 98 s.c.a.n. archives
- 5 Off-Topic
- 6 The Cogitation & Rumination Emporium
- Forum Test Area