New Members: Be sure to confirm your email address by clicking on the link that was sent to your email inbox. You will not be able to post messages until you click that link.
What is the second parameter in the ROC Signal(x,x) clause?

Hi all,
Here are 2 default clauses that come up in the advanced scan workbench:
and [ROC(12) > 0.0]
and [ROC Signal(12,30) > ROC(12)]
I figure the 30 in the second parameter must be the number of bars that ROC(12) is smoothed? Also, is this an SMA or EMA?
Is 30 the published smoothing period? The ChartSchool article does not mention this.
The more important question is why did I not know ROC has a signal line? I ask this because the ChartSchool articledoes not talk about it. Well, at the very bottom of the article it is barely mentioned. I had to comb through the article to find it.
Here are the default clauses for TRIX:
and [TRIX(15,9) > 0.0]
and [TRIX Signal(15,9) < TRIX(15,9)]
What confused me at first is that TRIX, for example, has 2 parameters and so the TRIX Signal clause looks the same as the TRIX clause. For TRIX, the smoothing is 9, I figure, but can't remember for sure. Since ROC only has 1 parameter, the second parameter in the ROC Signal threw me off.
Now that I know that ROC can be checked for a signal line cross from scanning, maybe I should add a 30 period SMA or EMA to ROC on a ChartStyle. This sounds like an improvement for using ROC. I have seen the ROC Signal clause in the past, but overlooked it because I was not sure what it was.
Here are 2 default clauses that come up in the advanced scan workbench:
and [ROC(12) > 0.0]
and [ROC Signal(12,30) > ROC(12)]
I figure the 30 in the second parameter must be the number of bars that ROC(12) is smoothed? Also, is this an SMA or EMA?
Is 30 the published smoothing period? The ChartSchool article does not mention this.
The more important question is why did I not know ROC has a signal line? I ask this because the ChartSchool article
Here are the default clauses for TRIX:
and [TRIX(15,9) > 0.0]
and [TRIX Signal(15,9) < TRIX(15,9)]
What confused me at first is that TRIX, for example, has 2 parameters and so the TRIX Signal clause looks the same as the TRIX clause. For TRIX, the smoothing is 9, I figure, but can't remember for sure. Since ROC only has 1 parameter, the second parameter in the ROC Signal threw me off.
Now that I know that ROC can be checked for a signal line cross from scanning, maybe I should add a 30 period SMA or EMA to ROC on a ChartStyle. This sounds like an improvement for using ROC. I have seen the ROC Signal clause in the past, but overlooked it because I was not sure what it was.
0
Best Answers
-
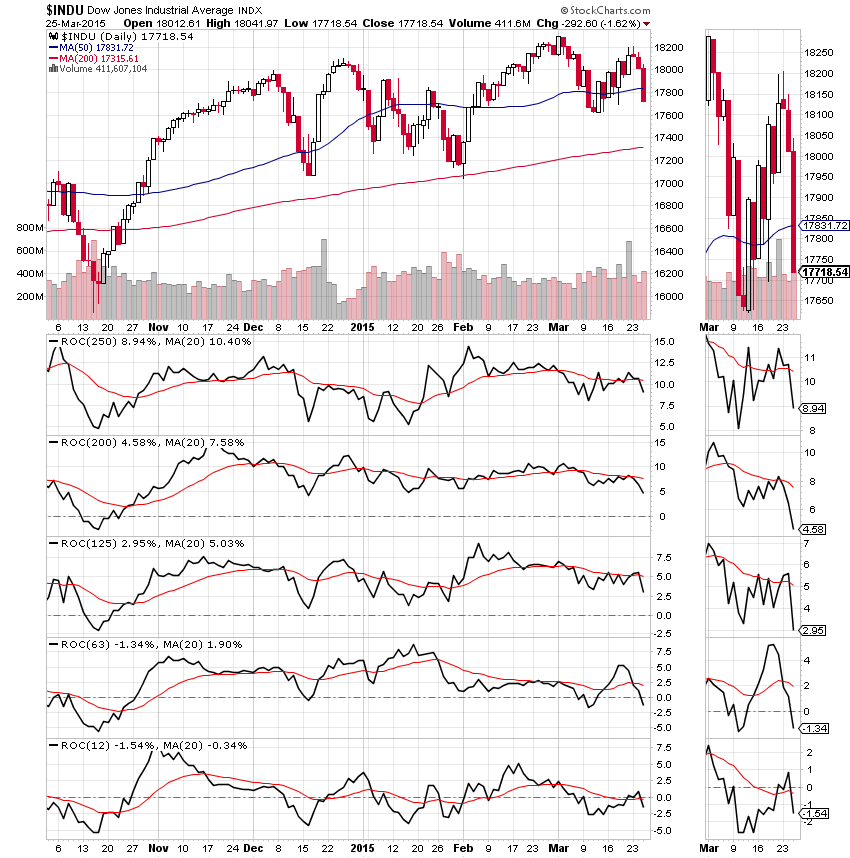
Kevo, the smoothing factor is an EMA, see the following chart for an example.
http://stockcharts.com/h-sc/ui?s=$COMPQ&p=D&b=5&g=0&id=p13567742850&a=201216941
0 -
Kevo, I know StockCharts has been adding many new functions lately and I'm not surprised its not detailed completely in the documentation. There's usually a blog announcement and the people who requested it know immediately what they want to use it for. Not every function or combinations of functions are necessarily useful to everyone, depends on trading/investing style.
Not every indicator or function is a trading scan, nor are the defaults any kind of recommendation, they just show you the format of the syntax. The default for SMA today is "and [SMA(50,volume) > 9999999]", it could just have easily been, "and [SMA(50,close) < close]"0

Answers
-
Ohhh. EMA got it. Thanks Gord.
I did not understand how you figured this by looking at the chart above. I only understood it after bringing up the chart and looking at the settings in the SharpCharts workbench. I see. Nice work.
The next thing I am wondering about is why would SCC build a ROC Signal clause in the scan engine without giving it any coverage in the ChartSchool article? Does this imply there is something wrong like it is not a good scan, or could it simply be an oversight (not discussing it in ChartSchool)? Just curious.0 -
I decided on a 20 period EMA for ROC since it's faster. I'm not sure why SCC picked 30 as the default. My ChartStyle will look something like this:
My first impression is that the cross-over signals look mixed. Mainly what I will look for is to see if the red EMA is above zero on the small ranges, look at the direction of the EMA on the smaller ranges, check if ROC is negative, and see how the smaller ranges affect the longer ranges. It's another tool in the toolbox.
I know the literature says it measures momentum, but I seem to like it to help measure trend.0 -
Hi Kevo, if you want to do some more exploring with ROC you could try:
add ROC(21) to your charts style twice
set the second ROC to "Behind Ind"
set both to Opacity 0.0
for the top ROC add overlay ema5
for the second ROC, add overlay ema13
Only the two emas show up; the actual ROC(21) line is hidden (invisible).
When the 5 is above the 13, think long
When the 5 is below the 13, think short (or out)
When running parallel, or over an under and over, think wait
You can choose any other parameter sets; the idea is that the emas (or smas) smooth out the ROC to give a clearer sense of what's happening. Note that on the most recent rally, 5 did not get back above 13.
P.S. I don't actually use this myself, and the idea is not original with me. I think it comes from an entry in the old s.c.a.n., but I thought you might be interested.
0 -
Quote from markd:
"When running parallel, or over an under and over, think wait"
Quotes from gord:"Not every function or combinations of functions are necessarily useful to everyone, depends on trading/investing style."
"Not every indicator or function is a trading scan, nor are the defaults any kind of recommendation, they just show you the format of the syntax."
That's helpful. Thanks guys!0

Categories
- All Categories
- 2.4K StockCharts
- 397 SharpCharts
- 146 Other Charting Tools
- 69 Saved Charts and ChartLists
- 1.5K Scanning
- 74 Data Issues
- 177 Other StockCharts Questions
- 218 Technical Analysis
- 155 Using Technical Analysis
- 2 InterMarket and International
- 19 Market and Breadth Indicators
- 42 Market Analysis
- 109 Trading
- 109 Trading Strategies
- 162 S.C.A.N the StockCharts Answer Network forum
- 64 Using this StockCharts Answer Network forum
- 98 s.c.a.n. archives
- 5 Off-Topic
- 6 The Cogitation & Rumination Emporium
- Forum Test Area