
Howdy, Stranger!
Categories
- All Categories
- 2.3K StockCharts
- 394 SharpCharts
- 145 Other Charting Tools
- 69 Saved Charts and ChartLists
- 1.5K Scanning
- 72 Data Issues
- 175 Other StockCharts Questions
- 216 Technical Analysis
- 153 Using Technical Analysis
- 2 InterMarket and International
- 19 Market and Breadth Indicators
- 42 Market Analysis
- 107 Trading
- 107 Trading Strategies
- 163 S.C.A.N the StockCharts Answer Network forum
- 65 Using this StockCharts Answer Network forum
- 98 s.c.a.n. archives
- 5 Off-Topic
- 6 The Cogitation & Rumination Emporium
- Forum Test Area
New Members: Be sure to confirm your email address by clicking on the link that was sent to your email inbox. You will not be able to post messages until you click that link.
Options
ETF Tracking Question
 tterry
✭
tterry
✭
in SharpCharts
We know that ETFs (like QQQ) track indexes (like $NDX). We know that on any given day, the ETF won't be exactly the price of the index. We know that over time, however, the ETF price will fluctuate around the index.
What I don't understand is why this ratio ($NDX:QQQ in this case) doesn't vary around some constant ratio. Instead, it shows an obvious negative slope over time. Other ratios ($SPX:SPY, $INDU:DIA) exhibit the same non-horizontal shape. One example is shown below.
I just want to know why the chart doesn't show a horizontal shape. (Is it related to the cumulative tracking error, and if so, how?)
0
Best Answer
-
 gord
admin
Yes this is a common mistake, the problem is with the ratio you are using. $SPX is an index, were as SPY is an ETF which pays a dividend quarterly along with an expense ratio charge, (currently 0.09%).
gord
admin
Yes this is a common mistake, the problem is with the ratio you are using. $SPX is an index, were as SPY is an ETF which pays a dividend quarterly along with an expense ratio charge, (currently 0.09%).
Now the expense charge is very small and hard to really pick out on the chart, but the dividend adjustments make quite a difference and this is what you are seeing. To avoid this, ratio the $SPX (unadjusted index) with the unadjusted SPY (just put an underscore in front of the symbol _SPY).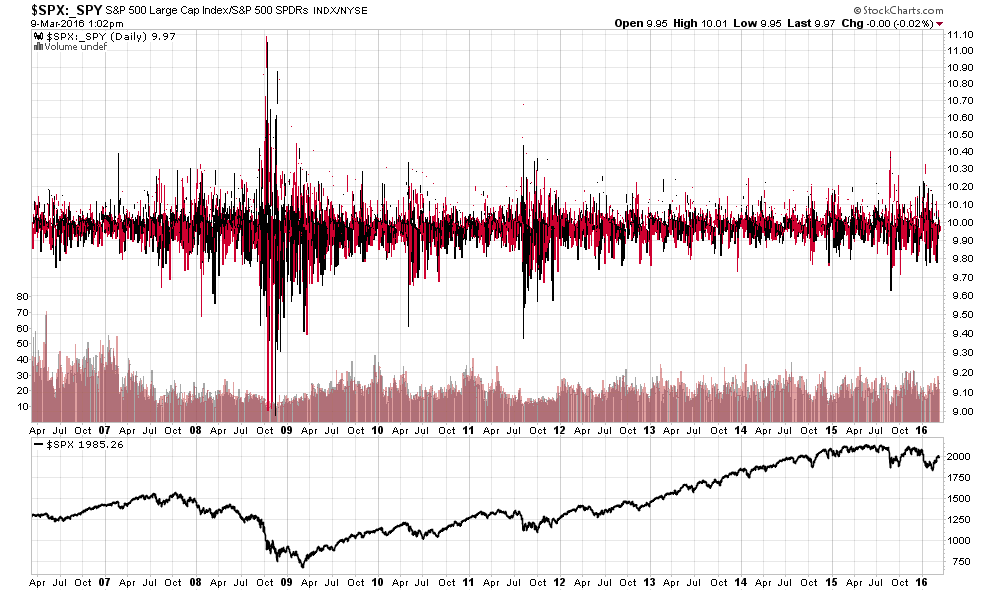
Now to see this a little more closely I've changed to a line chart which only shows the "close" instead of the OHLC which is very noisy chart. I've also zoomed in to just 2 years to get a little more detail and added "Events" to show when the dividends happened.
http://stockcharts.com/h-sc/ui?s=_SPY&p=D&yr=2&mn=0&dy=0&id=p51869883624
Hope this clears things up.
0
Answers