
Howdy, Stranger!
Categories
- All Categories
- 2.3K StockCharts
- 394 SharpCharts
- 145 Other Charting Tools
- 69 Saved Charts and ChartLists
- 1.5K Scanning
- 72 Data Issues
- 174 Other StockCharts Questions
- 215 Technical Analysis
- 153 Using Technical Analysis
- 2 InterMarket and International
- 19 Market and Breadth Indicators
- 41 Market Analysis
- 107 Trading
- 107 Trading Strategies
- 164 S.C.A.N the StockCharts Answer Network forum
- 65 Using this StockCharts Answer Network forum
- 99 s.c.a.n. archives
- 17 Off-Topic
- 10 The Cogitation & Rumination Emporium
- 7 Forum Test Area
New Members: Be sure to confirm your email address by clicking on the link that was sent to your email inbox. You will not be able to post messages until you click that link.
Options
Is it possible to view RSI lines from multiple time frames on the samechart?
 BobS
✭
BobS
✭
in SharpCharts
I find great advantage in viewing the lines for Slow stochastics in multiple time frames on the same chart, using a different color for each time frame. I also commonly get useful data from the RSI for the default setting both in the daily time frame and the weekly time frame. Is there a way to view the RSI line for the default value in the weekly time frame (14 weeks) on the daily chart?
In trying to do this I gave the RSI on the daily chart the parameter 70 (14 x 5 days/week). But this gives a line that never gets to Oversold or Overbought.
Any thoughts on how to get a line on the daily RSI that is close to that on the Weekly RSi?
Thanks.
In trying to do this I gave the RSI on the daily chart the parameter 70 (14 x 5 days/week). But this gives a line that never gets to Oversold or Overbought.
Any thoughts on how to get a line on the daily RSI that is close to that on the Weekly RSi?
Thanks.
0
Best Answer
-
 gord
admin
The short answer is No. Yes I see your example of Slow Stoch in multiple time frames overlayed, although they are not really multiple time frames as in daily and weekly, what you are looking at is different periods of daily bars overlayed. And as you say there is no real connection (ie setting period change) that will give you a consistent weekly value of an indicator calculated from daily bars, it has to be calculated from the weekly closing bars.
gord
admin
The short answer is No. Yes I see your example of Slow Stoch in multiple time frames overlayed, although they are not really multiple time frames as in daily and weekly, what you are looking at is different periods of daily bars overlayed. And as you say there is no real connection (ie setting period change) that will give you a consistent weekly value of an indicator calculated from daily bars, it has to be calculated from the weekly closing bars.
Now that said you can create a custom Gallery view which will show the daily and weekly correct values on the same screen, for say RSI. Below is a screen shot of a quick gallery chart setting I just created. I set up a custom "GalleryDaily" for 1 year, with RSI(14). Then set up a custom "GalleryWeekly" for 1 year, with RSI(14), I made the price invisible, placed the RSI behind price and then sized the height to match the RSI panel in the Daily above.
This gives you what you are looking for in an easy to see chart, hope this gives you some other ideas.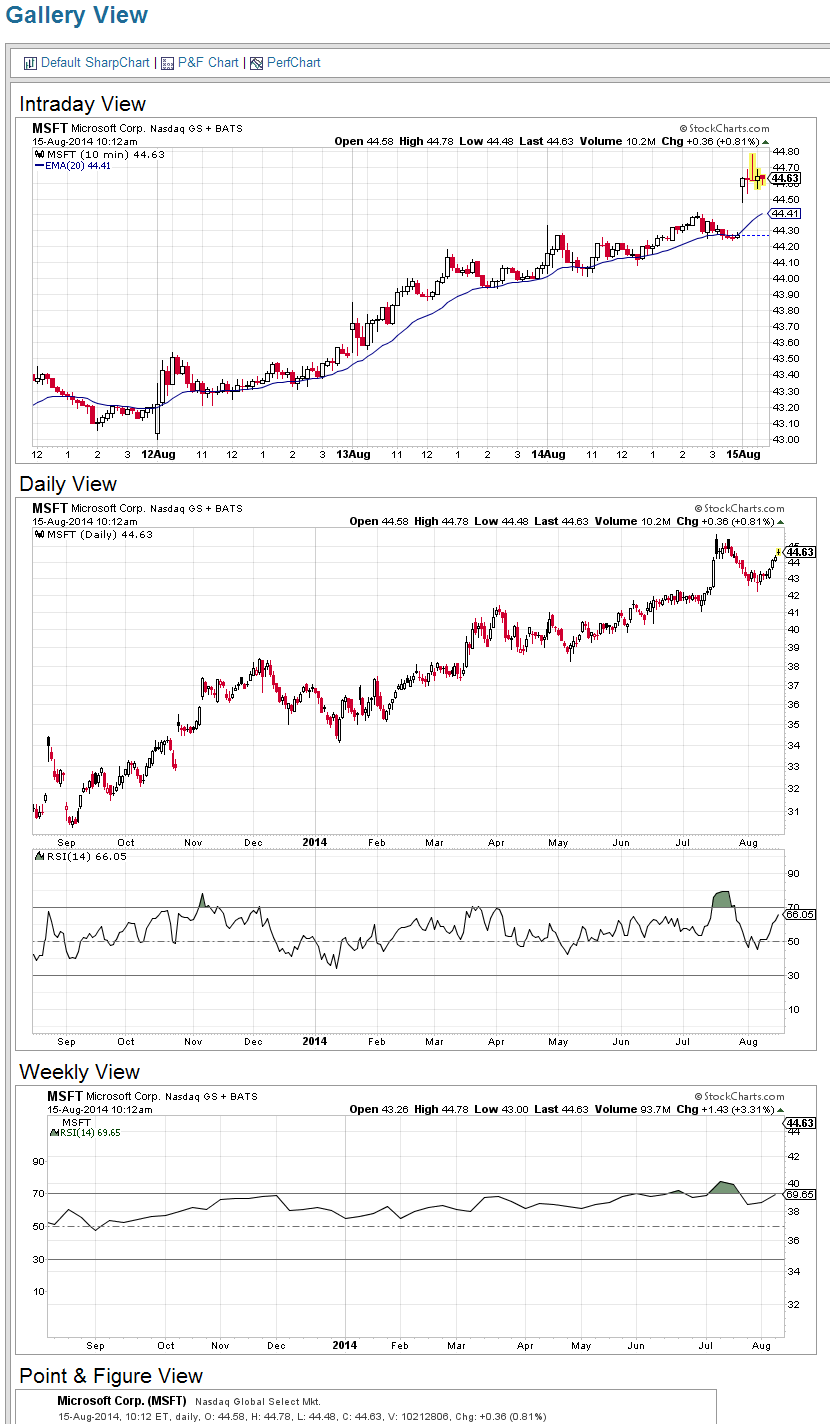
cheers Gord
0
Answers
1. Thanks for explaining what I have been doing with plotting several different values of Slow Stochastics overlayed (in different colors) in the same indicator panel.
2. Thanks for going the extra mile to show me a possible work-around. I was afraid that what I was asking for was mathematically impossible. But I thought I should ask just in case someone more familiar with the extensive capacity of the software behind this website might have some ideas. You did. Thanks.
2. Thanks for directing my attention to the feature (new to 2014 I think) within Stockcharts of customizing Gallery View. I had forgotten how to do that. So I checked the blog (http://stockcharts.com/articles/chartwatchers/2013/06/now-you-can-customize-galleryview-charts-this-might-just-change-everything.html) in which Chip Anderson explained it quite well.
3. Thank you for taking the time to set up a new customized set of chart-styles to customize Gallery view to provide a workaround to address my desire. Your example stimulated my thinking further (as you suggested) to explore to better meet the need. In order to get the RSI panels to almost match in height I found that I needed to set the top RSI panel to .5 (given the smallest height allowed for the lower panel(s) of RSI. I also included the intraday into the mix setting all 3 (intraday, daily and weekly) to 4 months.
I believe the suggestion Elder has made to view your charts in 3 time frames has merit. Consequently, I like seeing Weekly, Daily and Hourly. On my desktop at home I use Mozilla's "Tile Tabs" addon to view all of these on my 2 landscape monitors. However, I am at the end of a month long business + vacation trip to Thailand, and am confined to my 13 inch ultrabook. Thus, putting 3 on one Gallery view and specifically just bringing the RSI (or another indicator or 2) onto the chart helps a lot.
I would love it even better if the intraday Gallery view could be hourly and if the PNF chart could be made invisible. From Chip's article it seems that neither of these is possible at the current time. With your long experience with Stockcharts and your incredible understanding of programming, would you happen to know whether either of these are being considered for future enhancements.
Thanks again so much. It was a big help.
BobS