New Members: Be sure to confirm your email address by clicking on the link that was sent to your email inbox. You will not be able to post messages until you click that link.
Zahorchak Breadth Signal shown

lmkwin
✭✭
One of the Breadth indicators on StockCharts is the Zahorchak measure.
Greg Morris, a long time contributor on the StockCharts blogs brought this indicator to StockCharts and also provided a revised version as an alternate.
You can read more about that here:
https://stockcharts.com/articles/dancing/2015/09/zahorchak-measure-ii.html
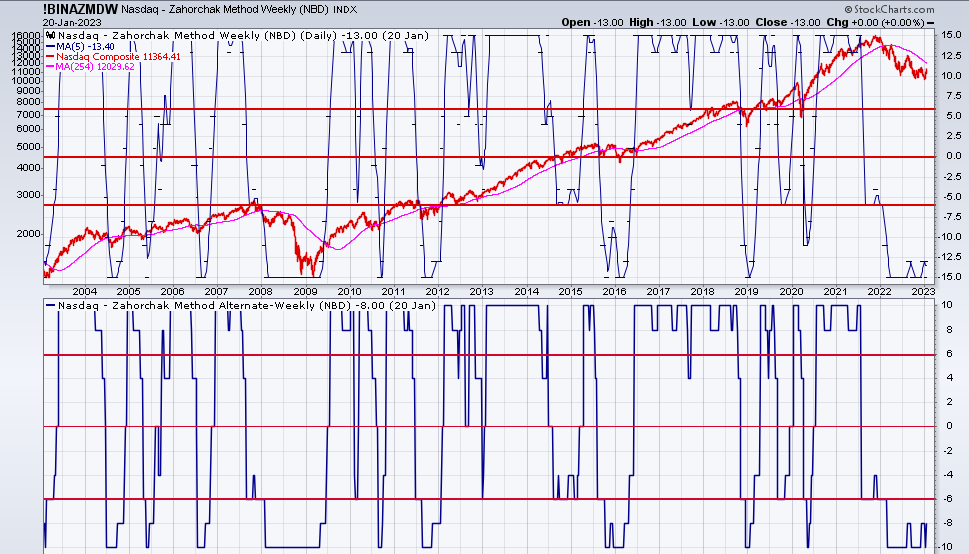
The chart below shows both the 'old' (top panel) and the revised version. The original version ranged from +15 to -15. The revised version goes from +10 to -10. The 'signal' lines are the same. The line chart for VTI is shown in the top panel for observation purposes.

You may note that the NYSE version has moved above -6 already on the revised and printed -6 today on the original version.
The Nasdaq versions of these indicators hasn't moved above -6 yet.
Greg Morris, a long time contributor on the StockCharts blogs brought this indicator to StockCharts and also provided a revised version as an alternate.
You can read more about that here:
https://stockcharts.com/articles/dancing/2015/09/zahorchak-measure-ii.html
The chart below shows both the 'old' (top panel) and the revised version. The original version ranged from +15 to -15. The revised version goes from +10 to -10. The 'signal' lines are the same. The line chart for VTI is shown in the top panel for observation purposes.
You may note that the NYSE version has moved above -6 already on the revised and printed -6 today on the original version.
The Nasdaq versions of these indicators hasn't moved above -6 yet.
0
Categories
- All Categories
- 2.4K StockCharts
- 397 SharpCharts
- 146 Other Charting Tools
- 69 Saved Charts and ChartLists
- 1.5K Scanning
- 74 Data Issues
- 177 Other StockCharts Questions
- 218 Technical Analysis
- 155 Using Technical Analysis
- 2 InterMarket and International
- 19 Market and Breadth Indicators
- 42 Market Analysis
- 109 Trading
- 109 Trading Strategies
- 162 S.C.A.N the StockCharts Answer Network forum
- 64 Using this StockCharts Answer Network forum
- 98 s.c.a.n. archives
- 5 Off-Topic
- 6 The Cogitation & Rumination Emporium
- Forum Test Area