New Members: Be sure to confirm your email address by clicking on the link that was sent to your email inbox. You will not be able to post messages until you click that link.
Percentage Above The EMA ?

Hi;
How you calculate the the percentage that an individual stock is above an EMA?
For example, maybe you want to sell a stock when it gets 10 % above the EMA ( 50 ).
When a stock goes parabolic, how do you know what percentage it is above a chosen EMA?
0
Best Answer
-
And you can add your 50 d EMA on there to show the middle of the envelope if you like
And you can also add another EMA Envelope with a smaller % parameter (in this case 50,4) and you can set the Style to Area to shade the Envelope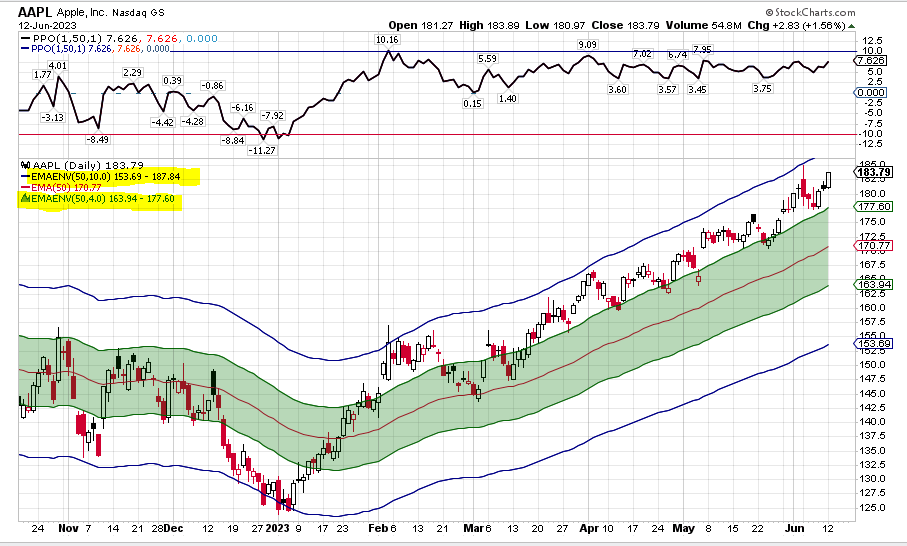
0

Answers
-
A couple ways come to mind. One is to use the EMA Envelope function. You set your EMA value and then the percentage you want the bands. So an EMA Envelope of 50,10 would put two lines on the chart, one at +10% above the 50 EMA and the other at -10% below the EMA. For SMA, you'd just pick the SMA Envelope and do your settings in the same way.
Another way is to use the PPO Indicator. It defaults in with the 12,26,9 parameters. Just change the 12 to a 1. Change the 26 to your EMA of choice, in this case, 50. Set the 9 to whatever you'd like. The 1,50,?? will show the percentage difference between the 1 period EMA and the 50 period EMA. The numbers will show on the scale, and you can see the current value in the upper left hand corner of the PPO. The last number is just a moving average of the difference between the 1st two numbers.
You can also add an overlay on the PPO called a Horizontal Line. Set the parameter at 10 and you will be able to see when the price difference reaches that percent.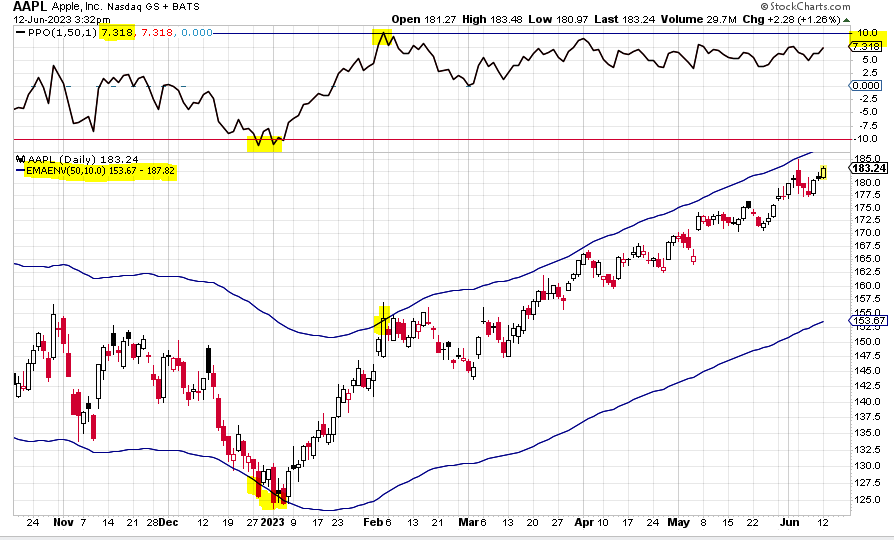
Note I added a line at -10 and made it red and a line at 10 on the PPO Overlay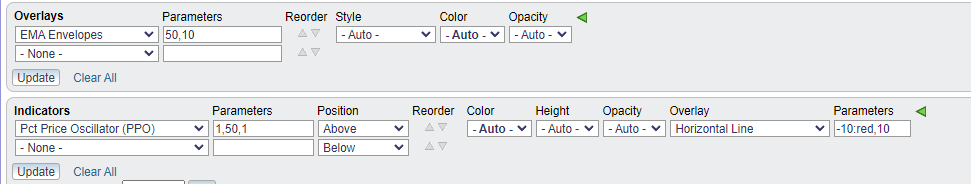
Using the PPO method you will always know the value, as it is displayed on the PPO. On the EMA Envelopes you would need to play around with the 2nd parameter to increase or decrease it to get it to intersect with a close price on the chart.
0 -
The actual math (which the indicators do for you) would be to divide the close by the EMA, or
close / EMA
So if the EMA is 10, and the close is 15
15/10 = 1.5 - the close is 1.5 times, or 150% of the EMA (or 50% more than the EMA, same thing).
if the EMA is 10, and the close is 5,
5/10 = .5 - the close is 50% of the EMA.
If you want to go the other way, to anticipate where, say, 10% above the EMA would be, you would multiply
EMA * 1.1
10 * 1.1 = 11
Note, the numbers to the right of the decimal point are fractions of the whole (in this case, the EMA) - which is what percentages are - fractions of the whole.
so 0.9 would 90% - if the EMA is 10, 10 * 0.9 = 9; so 9 is 10 % below 10
and 1.1 would be 110% - if the EMA is 10, 10 * 1.1 = 11; so 11 is 10% above 10
0 -
Very Insightful ! Many Thanks !0

Categories
- All Categories
- 2.4K StockCharts
- 397 SharpCharts
- 146 Other Charting Tools
- 69 Saved Charts and ChartLists
- 1.5K Scanning
- 74 Data Issues
- 177 Other StockCharts Questions
- 218 Technical Analysis
- 155 Using Technical Analysis
- 2 InterMarket and International
- 19 Market and Breadth Indicators
- 42 Market Analysis
- 109 Trading
- 109 Trading Strategies
- 163 S.C.A.N the StockCharts Answer Network forum
- 65 Using this StockCharts Answer Network forum
- 98 s.c.a.n. archives
- 5 Off-Topic
- 6 The Cogitation & Rumination Emporium
- Forum Test Area