New Members: Be sure to confirm your email address by clicking on the link that was sent to your email inbox. You will not be able to post messages until you click that link.
Wyckoff in real time

markd
mod
So, just for fun, let's look at some charts that seem to show Wyckoff-like accumulation in real time, and then see how they do.
I've reviewed the sector etfs and found the Consumer Discretionary etf, XLY is show emergent relative strength. With all the recession talk, you would think XLY would not be the place to go. But let's see what happens.

This is a weekly chart of XLY. The top panel is sector strength relative to the sp500. The gold dotted line is RS, the wavy solid line is the 52 week MA, the green wavy line a 13 week (quarterly) MA.
As you can see, RS bottomed around January and has been rising. It's just crossed the long MA, and the short MA is about to cross the long MA. If we are still in a bear market, sellers should jump on buyer strength, as they did back in Nov 21 and Aug 22. But the difference is this time that Force shows accumulation also crossing above its long MA and staying there.
So there has been net buying despite continued declining prices and RS. Retail traders don't do that, so this is likely professional buying.
Next, which industries are showing better RS within XLY?
symbols showing improving RS - to see RS I'm using, use the ratio symbol $DJUSxx:XLY, with 52 wk and 13 wk MAs on RS, on 2 year weekly chart,
$DJUSHB - home builders - in mark up phase
$DJUSAU - autos - just starting mark up phase
$DJUSRB - broadline retailers - a few weeks into mark up
$DJUSTT - travel and tourism - in a mild pullback after intial markup ?
$DJUSRQ - recreational services - starting the mark up phase
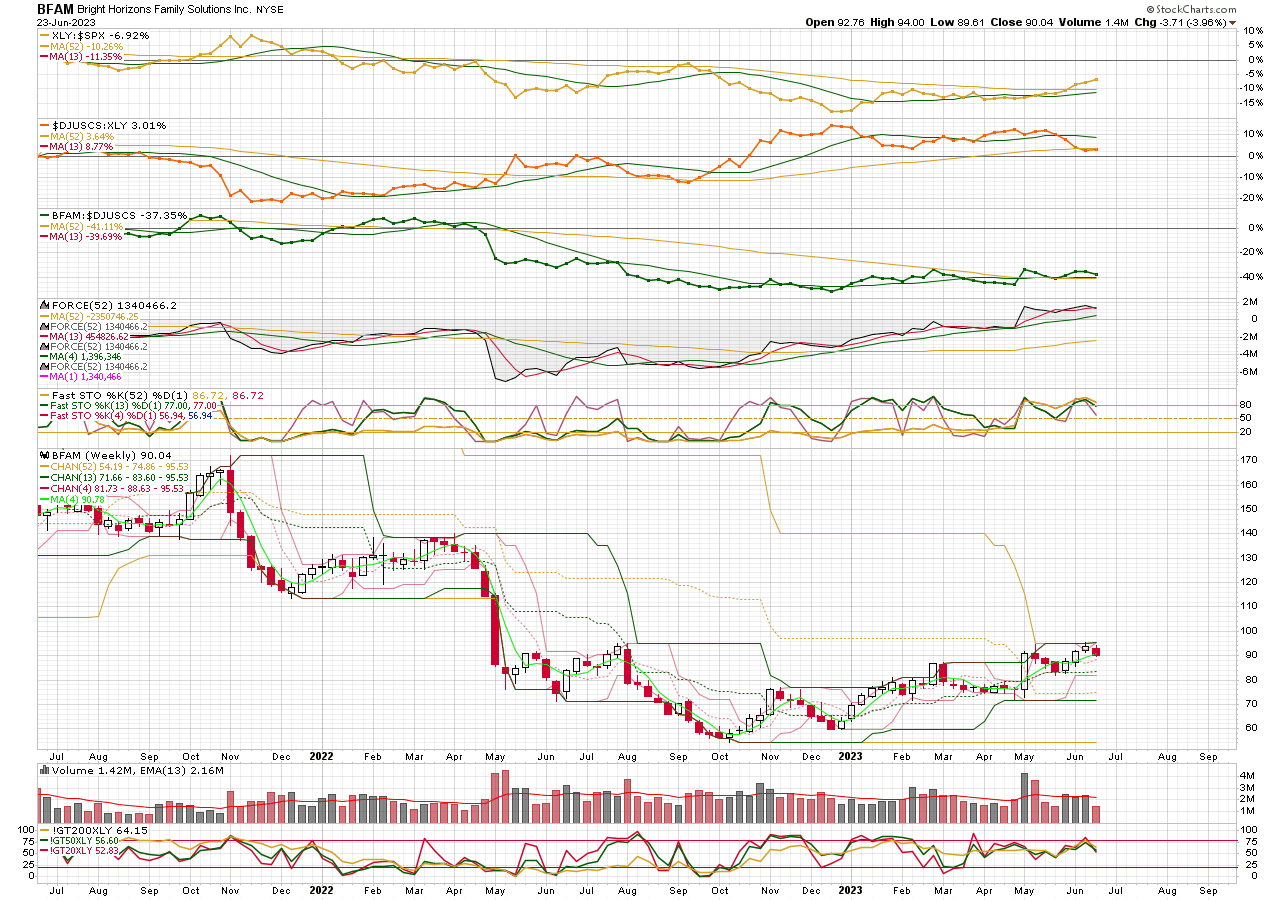
$DJUSCS - specialized consumer services - has been strong, possibly ready for a new phase.
$DJUSHB - almost everything is far beyond the accumulation stage; BZH and HOV appear to be just starting up the mark up phase. But laggards in a group are not usually the best place to be.
$DJUSAU - TSLA, TM, F recently broke out and RACE has been marking up for some time, LI is advancing without a ranging period first; TM and F showed the most similar pattern of Force rising as price ranged, but RS was strong as price lagged, and now it is losing RS as price rises. This is not typical of the "undercover" operations of a Wyckoffian campaign, so it seems unlikely these stocks are being managed by operators.
$DJUSRB - AMZN looks good from a Wyckoff perspective:

This probably shouldn't be a surprise. As a large cap, it's probably responsible for a lot of the XLY behavior. You can see where price dipped lower and Force did not, showing professional accumulation, and now RS is improving coincident with the mark up phase. Entry now would be a few weeks late, but there's probably more to go.
$DJUSTT - TZOO is in the mark up phase after a pretty good accumulation phase.
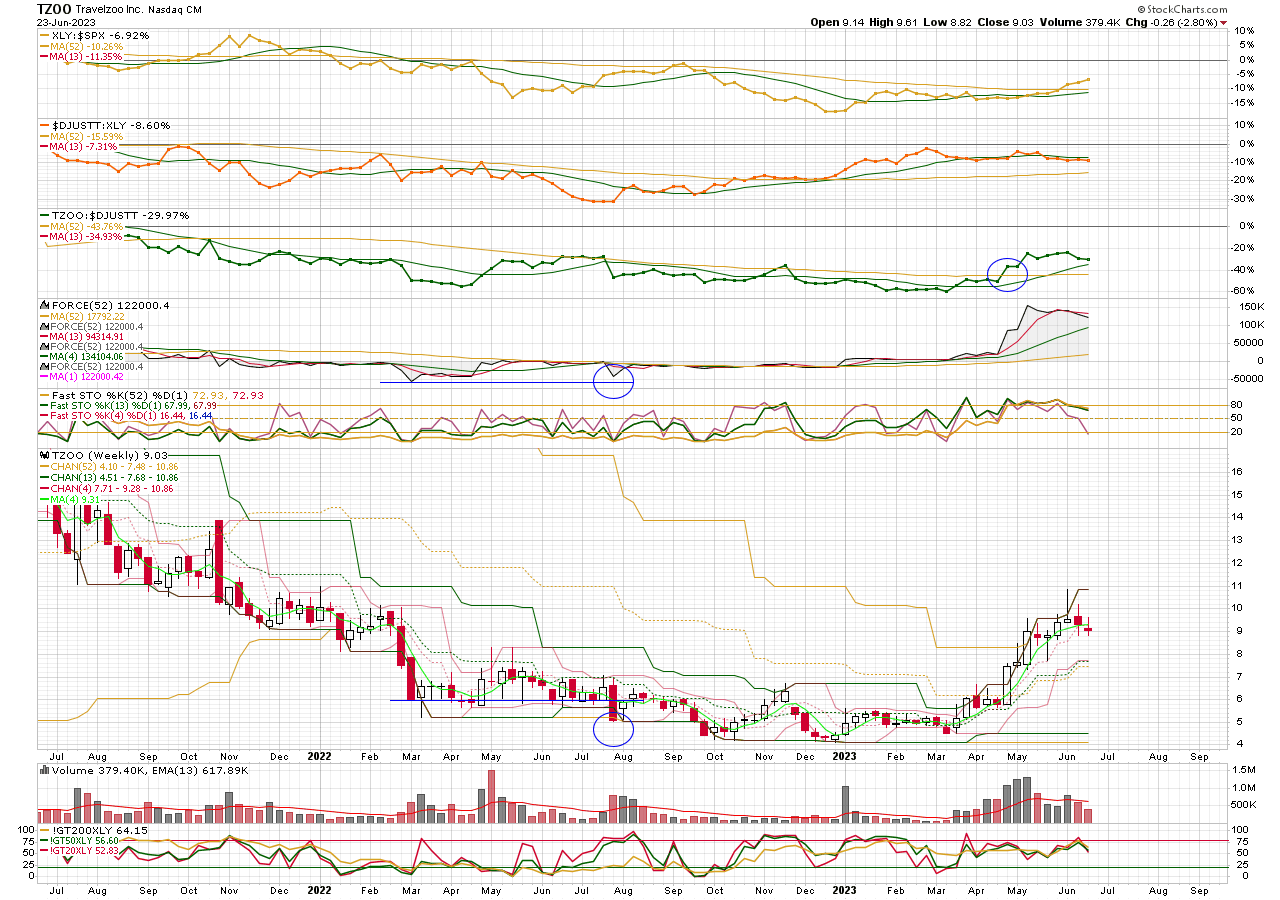
Prior to the huge volume in January, this looked a little doubtful. RS had bottomed but couldn't stay its MA. But the large volume and failure to sell off afterward showed strong professional interest.
Airbnb may be in mid stage accumulation, but there are some problems with it.

The first attempt at accumulation (Jul - Aug) didn't really work out - Force came back to its original levels before price did. The second attempt looks better. After the big selloff in Nov, price drops lower but doesn't attract much volume, then buyers push it up and into a range, containing both heavy buying and selling, which is consistent with Wyckoff operator methods. RS hasn't bottomed, or flattened or improved. That didn't stop TZOO, but ABNB doesn't show the buying conviction we saw in TZOO in January. The sloppiness suggests, if there are operators involved, they are not in complete control. So, a pass on this one. Not that it couldn't work out, but I would want more quality in the set up. @lmkwin, what does P&F say?
EXPE also seems to be in mid accumulation and is worth watch listing:

Force has steadily climbed as price ranges and RS show signs of bottoming and improving. If you are aggressive, you could buy it, or else wait for the RS breakout.
$DJUSRQ - CUK is just about perfect Wyckoff accumulation form. It's just breaking out. Other cruise lines are ahead of it, but it still looks good:

From June 22, Force rises while price makes new lows and then ranges. RS bottoms in Oct 22, then stays steady until it crosses its MA with the price breakout in May. Pretty much everything you want to see - a long sell off, new lows w/o Force confirmation, price fails to go lower on big volume (first two weeks of October), extended range stays off the bottom and so does RS; RS and price break out together. So this is a buy now or on a minor pullback.
Note the RCL and CCL charts are similar, but not the same. Price and Force and RS all bottom more or less together, and rise together. And they are doing better than CUK (or at least they are ahead of CUK). So, that shows price can move without accumulation.
$DJUSCS - several in this group. I won't mark them up or comment as time is short:

BFAM
FTDR

UPBD

ROVR

PETQ

QUOT

I've reviewed the sector etfs and found the Consumer Discretionary etf, XLY is show emergent relative strength. With all the recession talk, you would think XLY would not be the place to go. But let's see what happens.
This is a weekly chart of XLY. The top panel is sector strength relative to the sp500. The gold dotted line is RS, the wavy solid line is the 52 week MA, the green wavy line a 13 week (quarterly) MA.
As you can see, RS bottomed around January and has been rising. It's just crossed the long MA, and the short MA is about to cross the long MA. If we are still in a bear market, sellers should jump on buyer strength, as they did back in Nov 21 and Aug 22. But the difference is this time that Force shows accumulation also crossing above its long MA and staying there.
So there has been net buying despite continued declining prices and RS. Retail traders don't do that, so this is likely professional buying.
Next, which industries are showing better RS within XLY?
symbols showing improving RS - to see RS I'm using, use the ratio symbol $DJUSxx:XLY, with 52 wk and 13 wk MAs on RS, on 2 year weekly chart,
$DJUSHB - home builders - in mark up phase
$DJUSAU - autos - just starting mark up phase
$DJUSRB - broadline retailers - a few weeks into mark up
$DJUSTT - travel and tourism - in a mild pullback after intial markup ?
$DJUSRQ - recreational services - starting the mark up phase
$DJUSCS - specialized consumer services - has been strong, possibly ready for a new phase.
$DJUSHB - almost everything is far beyond the accumulation stage; BZH and HOV appear to be just starting up the mark up phase. But laggards in a group are not usually the best place to be.
$DJUSAU - TSLA, TM, F recently broke out and RACE has been marking up for some time, LI is advancing without a ranging period first; TM and F showed the most similar pattern of Force rising as price ranged, but RS was strong as price lagged, and now it is losing RS as price rises. This is not typical of the "undercover" operations of a Wyckoffian campaign, so it seems unlikely these stocks are being managed by operators.
$DJUSRB - AMZN looks good from a Wyckoff perspective:
This probably shouldn't be a surprise. As a large cap, it's probably responsible for a lot of the XLY behavior. You can see where price dipped lower and Force did not, showing professional accumulation, and now RS is improving coincident with the mark up phase. Entry now would be a few weeks late, but there's probably more to go.
$DJUSTT - TZOO is in the mark up phase after a pretty good accumulation phase.
Prior to the huge volume in January, this looked a little doubtful. RS had bottomed but couldn't stay its MA. But the large volume and failure to sell off afterward showed strong professional interest.
Airbnb may be in mid stage accumulation, but there are some problems with it.
The first attempt at accumulation (Jul - Aug) didn't really work out - Force came back to its original levels before price did. The second attempt looks better. After the big selloff in Nov, price drops lower but doesn't attract much volume, then buyers push it up and into a range, containing both heavy buying and selling, which is consistent with Wyckoff operator methods. RS hasn't bottomed, or flattened or improved. That didn't stop TZOO, but ABNB doesn't show the buying conviction we saw in TZOO in January. The sloppiness suggests, if there are operators involved, they are not in complete control. So, a pass on this one. Not that it couldn't work out, but I would want more quality in the set up. @lmkwin, what does P&F say?
EXPE also seems to be in mid accumulation and is worth watch listing:
Force has steadily climbed as price ranges and RS show signs of bottoming and improving. If you are aggressive, you could buy it, or else wait for the RS breakout.
$DJUSRQ - CUK is just about perfect Wyckoff accumulation form. It's just breaking out. Other cruise lines are ahead of it, but it still looks good:
From June 22, Force rises while price makes new lows and then ranges. RS bottoms in Oct 22, then stays steady until it crosses its MA with the price breakout in May. Pretty much everything you want to see - a long sell off, new lows w/o Force confirmation, price fails to go lower on big volume (first two weeks of October), extended range stays off the bottom and so does RS; RS and price break out together. So this is a buy now or on a minor pullback.
Note the RCL and CCL charts are similar, but not the same. Price and Force and RS all bottom more or less together, and rise together. And they are doing better than CUK (or at least they are ahead of CUK). So, that shows price can move without accumulation.
$DJUSCS - several in this group. I won't mark them up or comment as time is short:
BFAM
FTDR
UPBD
ROVR
PETQ
QUOT
0
Comments
-
Thanks ... nice charts.
How do you find these? With a scan? Can you share that scan with us?0 -
There was no scan.
I looked at sector RS first, XLE:$SPX, XLB,$SPC, etc. and looked for EMERGING relative strength - which I define as the RS line poking above its descending 52 week MA - top panel on all these charts.
Then I looked for industry strength within the sector - it could be emerging or established - established is RS above the rising MA and the RS line itself rising or more or less flat.
Finally, within the industry, I look for stocks no longer making new lows in Force because that MAY indicate accumulation. Then I look at price and volume behaviors that indicate the presence of strong support - especially big volume days that leave tails at new lows, or fail to make new lows at all, and then follow up buying that produces a range usually just off the lows. And meanwhile, RS has bottomed or lost downward momentum.
I suppose you could scan for a 52 week lower channel at its 52 week minimum and flat for maybe 10 weeks, and an upper channel at its 52 week minimum, and Force above its 52 week MA. That would not produce all good hits, but good ones should be in the results among the chaff.
It would look like this - choose your universe first. AND - since it uses a volume indicator - set the "Starting" time to "last market close", not last intraday update.
and [weekly Upper Price Chan(52) = weekly min(52, weekly Upper Price Chan(52))]
and [weekly Lower Price Chan(52) = weekly min(52, weekly Lower Price Chan(52))]
and [weekly Lower Price Chan(20) = 10 weeks ago weekly Lower Price Chan(52)]
and [weekly Force(52) > weekly sma(4, weekly Force(52))]0


Categories
- All Categories
- 2.3K StockCharts
- 396 SharpCharts
- 146 Other Charting Tools
- 69 Saved Charts and ChartLists
- 1.5K Scanning
- 74 Data Issues
- 177 Other StockCharts Questions
- 218 Technical Analysis
- 155 Using Technical Analysis
- 2 InterMarket and International
- 19 Market and Breadth Indicators
- 42 Market Analysis
- 109 Trading
- 109 Trading Strategies
- 163 S.C.A.N the StockCharts Answer Network forum
- 65 Using this StockCharts Answer Network forum
- 98 s.c.a.n. archives
- 5 Off-Topic
- 6 The Cogitation & Rumination Emporium
- Forum Test Area