New Members: Be sure to confirm your email address by clicking on the link that was sent to your email inbox. You will not be able to post messages until you click that link.
Tips, Tricks and undocumented feature for StockCharts.com

lmkwin
✭✭
in SharpCharts
There are a bunch of tips and tricks and undocumented features shared on this forum over the decades. Most are buried in the threads of various other topics, but we haven't a place that stored any of it in it's own thread.
So, similar to the Suggestions to StockCharts thread, where we can share our suggestions we made to StockCharts.com for enhancements / improvements, maybe this tread will be a place to share things we do to customize our StockCharts experiences.
I'll start. I use the Full Stochastic on my time based charts. I use the Full as its versatility allows you to have it replicate the Fast or the Slow Stochastic simply by changing the parameters. A 14,3,3 Full equals a 14,3 Slow. A 14,1,3 Full equals a 14,3 Fast. The Stochastic is made up of a %K line and a %D line. The %D line (the last number in the parameters) is the simple moving average of the %K line. George Lane, credited with creating the stochastic indicator, paid attention to the %D at some point in his long and illustrious career.
Tips and Tricks:
There are ways to modify the look of the Stochastics on your charts by adding overlays to the indicator.
The Standard or Default view is fine, but you may want to focus your attention or make it easier to see levels or occurances that are important to YOU. I try to help myself by making what I want to see, POP off the screen.
4 examples below
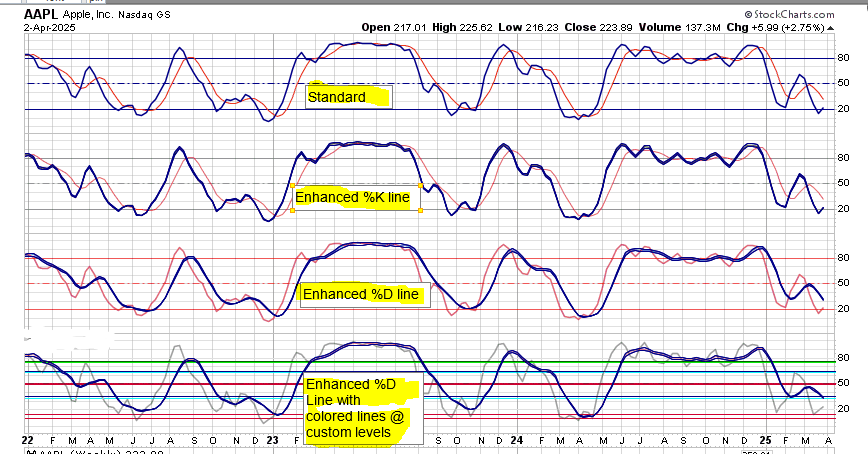
You can Highlight the line of interest (%K or %D) by placing a SMA Envelope overlay on the Stochastic. To highlight the %K use a SMA Env with a parameter of 1,1.5 for example. This will put a thicker outline on the %K line. To highlight the %D use a SMA Envelope overlay on the Stochasic with a parameter of the last parameter number of your Stochastic. Example: SMA Env parameter 3,1.5. This will put a thicker outline on the %D line. The 1.5 in the parameter is the distance from the SMA, so a 1,1.5 puts a line 1.5% above and below the SMA to create the Envelope.
The lower panel has Horizontal Line overlay on the Stochastic. The parameter on that one is 10:red,15:red,33:cyan,35:blue,49:red,50.65:red,63:cyan,65:blue,75:lime,76:green,20:white,80:white
I look at that like a hockey rink. Starting at the bottom at my goal line, until I move past my Blue Line, I'm on Defense. As I move past my Blue Line I transition to Offense by crossing the Red Line and am definitely on Offense when I cross the opponents Blue Line.
You can create multiple colored lines using the number colon color comma number colon color technique in the parameter field. The default lines on the Stochastic are 20,50,80. I "hide" those lines by making the 20 and 80 white.
So, similar to the Suggestions to StockCharts thread, where we can share our suggestions we made to StockCharts.com for enhancements / improvements, maybe this tread will be a place to share things we do to customize our StockCharts experiences.
I'll start. I use the Full Stochastic on my time based charts. I use the Full as its versatility allows you to have it replicate the Fast or the Slow Stochastic simply by changing the parameters. A 14,3,3 Full equals a 14,3 Slow. A 14,1,3 Full equals a 14,3 Fast. The Stochastic is made up of a %K line and a %D line. The %D line (the last number in the parameters) is the simple moving average of the %K line. George Lane, credited with creating the stochastic indicator, paid attention to the %D at some point in his long and illustrious career.
Tips and Tricks:
There are ways to modify the look of the Stochastics on your charts by adding overlays to the indicator.
The Standard or Default view is fine, but you may want to focus your attention or make it easier to see levels or occurances that are important to YOU. I try to help myself by making what I want to see, POP off the screen.
4 examples below
You can Highlight the line of interest (%K or %D) by placing a SMA Envelope overlay on the Stochastic. To highlight the %K use a SMA Env with a parameter of 1,1.5 for example. This will put a thicker outline on the %K line. To highlight the %D use a SMA Envelope overlay on the Stochasic with a parameter of the last parameter number of your Stochastic. Example: SMA Env parameter 3,1.5. This will put a thicker outline on the %D line. The 1.5 in the parameter is the distance from the SMA, so a 1,1.5 puts a line 1.5% above and below the SMA to create the Envelope.
The lower panel has Horizontal Line overlay on the Stochastic. The parameter on that one is 10:red,15:red,33:cyan,35:blue,49:red,50.65:red,63:cyan,65:blue,75:lime,76:green,20:white,80:white
I look at that like a hockey rink. Starting at the bottom at my goal line, until I move past my Blue Line, I'm on Defense. As I move past my Blue Line I transition to Offense by crossing the Red Line and am definitely on Offense when I cross the opponents Blue Line.
You can create multiple colored lines using the number colon color comma number colon color technique in the parameter field. The default lines on the Stochastic are 20,50,80. I "hide" those lines by making the 20 and 80 white.
0
Comments
-
Great idea. Thanks.
Ok, here is one ....
You can show a DAILY chart on other timeframes by adjusting the parameters.
Here is a DAILY timeframe shown on a 30 MINUTE CHART.
Just increase the numbers .... SMA 7 on daily ... is SMA 7 * 6.5 = SMA 45
Be sure to adjust ALL the indicators the same amount.
0 -
@azb I like that concept and use it. It gives visibility to other time frames on the chart you are using. I tend to "optimize" my weekly chart and then make the monthly and daily charts indicators reflective of the weekly chart's indicator parameters. So when I'm looking at a daily chart, I can see (approximately) where the weekly indicator levels are at the moment.
I should have mentioned in the Stochastic "trick" that you can also adjust the Opacity of the indicator to make the MA Envelopes pop even more. The Opacity of the bottom panel is set to 3. I adjust Opacity on many things to balance out what I want to see easily vs want to see sometimes.
0 -
Inside a recent thread I mentioned an undocumented feature on StockCharts. Coloring the MACD/PPO histogram
Undocumented feature:

0 -
Another interesting feature is the 'Position' column under indicators. There are four options for placing an indicator 'above' (meaning above the chart), 'below', 'behind' and - the kicker - 'behind indicator'.
With the 'behind indicator' option you can 'stack' different versions of the same indicator on top of each other. It can get messy, but depending on the indicator it can be very useful for saving real estate.
I use Price with $GT200SPX, $GT50SPX, $GT20SPX which track the percent of issues in the SP500 above each MA, 200, 50 and 20. The first Price is positioned 'below', and the others 'behind indicator'. When GT200 is rising or moving sideways above 80, the market likes to turn at or shortly after the GT20 or GT50 dipping below 50. Once the GT200 starts to slope down (drops below 80 and moves toward 50) the signals stop working.
You can do something similar with stacking Fast Ks. I use 251 (Fast Stoch %K(251,1), 63, 21 and 10. In strong markets, prices like to turn on or shortly after 10 or 21 dipping below 20. Likewise, in weak markets, prices like to turn when 10 or 21 get above 80.
The longer parameters tell you the longer term position of the market - if they are higher up, the market has been rising, if the are lower down, prices have been falling, and you know that without have to change the time frame of the chart, or lengthen the start/end.

The GTs also show non-confirmation around the Feb highs. Prices return to past highs, but none of the GTs do, meaning fewer stocks were responsible for the rally, indicating weakness likely.
0 -
Here's a tip that works for select limited times for those with questions for support but not getting responses.
Occasionally StockCharts solicits feedback from users. A banner may appear at the top of a page or screen that asks you to checkout some feature and provide feedback to them. The "new SharpCharts Workbench" is one I see now. They have had some in the past also.
Here's the tip:
Click on the "provide feedback" link and then give LEGITIMATE* feedback on the topic solicited. Then.... add your unresponded to comment or question that you requested from Support. They usually respond to their requests for feedback and LEGITIMATE* feedback, and may even provide you will further information on your unanswered inquiry.
*legitimate feedback is well thought out and pertinent to the request.
0 -
TIPS
This forum has been a tremendous resource to my education on many topics. The forum has a lot of threads on many different topics.
If there is a topic or thread on this forum that you would like to refer back to at some point, you can Bookmark the thread by clicking on the little gray Star in the upper right of the 1st post in the thread
The gear Icon allows you to Mute the thread.
On the Main page you can also do the same thing. There is a gray star you can click to bookmark the thread. If you hover over a thread the gear icon appears to allow you to Mute the thread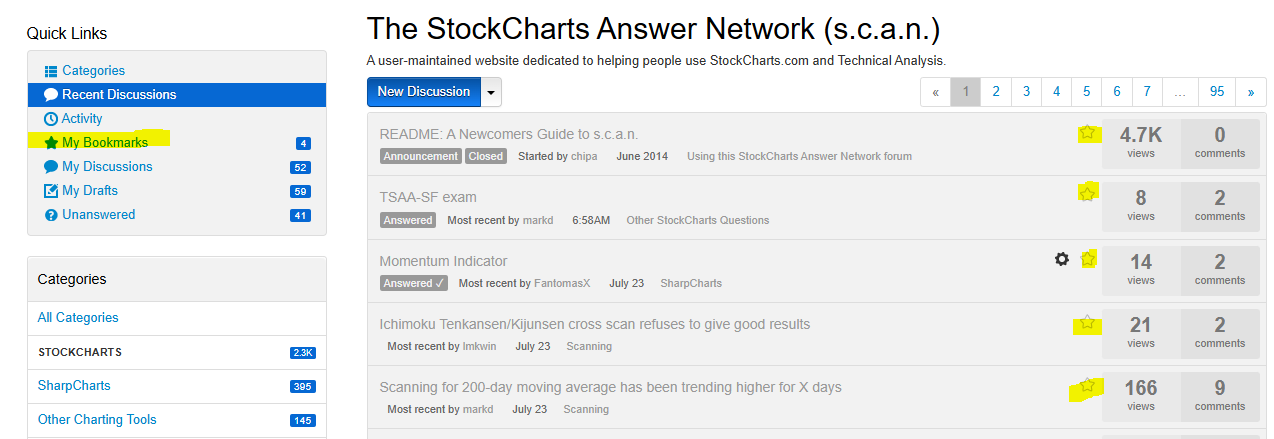
On the left side of the forum home page are Quick Links. One is My Bookmarks. This is where you will find your starred threads. To unbookmark, just click the star and it should turn from yellow back to gray.
There are also links to Your Discussions and other bits of information and data.
A helpful feature on the forum. If you post, you have 60 minutes to Edit the post. When you go back to your post, a Gear Icon at the top will show you how many minutes remaining if you want to edit the post. If you want to change your post, click the Gear. It's helpful to be able to edit/ update your posts. Using the Preview is also a good way to avoid having to edit/ update. Preview shows how the post will look. The edit button is at the bottom if you want to edit before posting.
You can also "think about posting" by entering a post and then clicking Save Draft. This will save your post in your My Drafts Quick Link. You can refer back to it later and possibly complete the post and post it, or just leave it there in Drafts, or delete it. Before I discovered the Bookmark, I used to Bookmark by typing a few characters into a reply and then click Save Draft.
0 -
Something that I use to work in an integrated way with other parts of the StockCharts system is my chartstyle naming. Particularly the Gallery View charts and the Industry and Market view charts.
I name my favorite IntraDay, Daily, and Weekly period charts GalleryIntraday, GalleryDaily and GalleryWeekly. These are the chartstyles that I most use, as Grayson likes to say, every single day. By using these naming conventions for these charts, when I click on Gallery View, my favorite chartstyles are also used in this view.
I will also take my favorite default chartstyle, in my case, the GalleryWeekly, and save that with the name Industry Summary, and also Market Summary.
In essence I have 1 chartstyle with 3 different names. The customized Industry Summary chartstyle will now be displayed when I go into the US Industries tab under Market Analysis.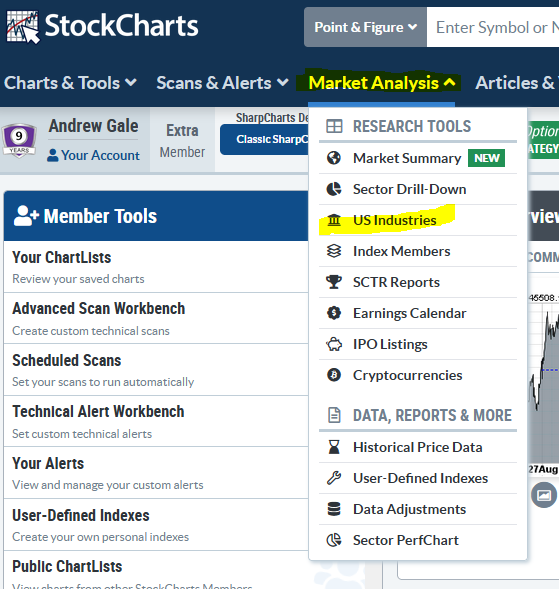
With the addition of the NEW Market Summary page, it appears that the custom Market Summary chartstyle is no longer needed / used so I'll be removing that chartstyle from my list.
Having your customized chartstyles used in other areas of the StockCharts system may make your experience even more enjoyable and fruitful.
0


Categories
- All Categories
- 2.3K StockCharts
- 397 SharpCharts
- 146 Other Charting Tools
- 69 Saved Charts and ChartLists
- 1.5K Scanning
- 74 Data Issues
- 177 Other StockCharts Questions
- 218 Technical Analysis
- 155 Using Technical Analysis
- 2 InterMarket and International
- 19 Market and Breadth Indicators
- 42 Market Analysis
- 109 Trading
- 109 Trading Strategies
- 163 S.C.A.N the StockCharts Answer Network forum
- 65 Using this StockCharts Answer Network forum
- 98 s.c.a.n. archives
- 5 Off-Topic
- 6 The Cogitation & Rumination Emporium
- Forum Test Area