New Members: Be sure to confirm your email address by clicking on the link that was sent to your email inbox. You will not be able to post messages until you click that link.
Ichimoku Tenkansen/Kijunsen cross scan refuses to give good results

in Scanning
Hi, so I use Ichimoku investing which is super convenient as a way to spot trends or places where I should take action. One of my scanners is supposed to catch stocks in my main chartlist (#21) when the tenkansen / conversion line and kijunsen / base line.
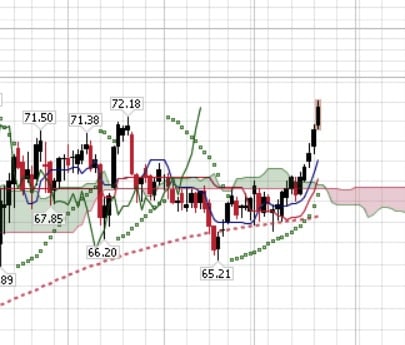
Here's an example, from XEL. The blue (tenkansen) and red (kijunsen) lines below price. A tenkan/kijun bullish twist took place on July 2, yet my scanner is just reporting it to me now, three weeks late. All my results are equally frustrating: I just want to catch the twist within 2 days, yet the results are not useful at all. Can anyone suggest a better approach?
Here is the latest version of my scan, made with the help of Chat GPT becasue it's 2025.
// Bullish Ichimoku Conversion/Base Line Cross within last 2 days on ChartList 21
// Scan Mode: End-of-Day Data Recommended
// Bullish Ichimoku Tenkan/Kijun Cross – Last 2 Days on ChartList 21
[[ChartList is 21] AND
[Ichimoku Conversion Line(9,26) > Ichimoku Base Line(26,52)] AND
[1 days ago Ichimoku Conversion Line(9,26) <= 1 days ago Ichimoku Base Line(26,52)]]
OR
[[ChartList is 21] AND
[1 days ago Ichimoku Conversion Line(9,26) > 1 days ago Ichimoku Base Line(26,52)] AND
[2 days ago Ichimoku Conversion Line(9,26) <= 2 days ago Ichimoku Base Line(26,52)]
]
0
Comments
-
I don't use Ichi so grain of salt. Also, you may have thought of these alternatives already.
I think I would diagnose the problem by looking at the chart as of the day you think you should have gotten the signal and check the state of Ichi then (i.e. set the chart end date to July 2)
Your code is catching the state of Ichi as of the hit date, which is why you get the signal (it might help to comment out one 'or' and then the other to see which one is triggering the hit).
But what is the state of Ichi as of the day you think you should get the signal?
What happens if you scan for Ichi values based on the chart as of your expected signal date?
I don't know which values the scan engine is looking at for Ichi - the end values added today but plotted into the future, or 'today' values added some time ago.
I'll look at it some more later.
Here's a link to the Ichi scan documentation, if that helps.
https://help.stockcharts.com/scanning-and-alerts/scan-writing-resource-center/scanning-case-studies/scanning-ichimoku-clouds0 -
When you add the lines from the workbench, they default in like this:
and [Ichimoku Conversion Line(9,26,52) > 0]
and [Ichimoku Base Line(9,26,52) > 0]
There are 3 parameters to each. I only see 2 in your lines.
[Ichimoku Conversion Line(9,26) > Ichimoku Base Line(26,52)] AND
[1 days ago Ichimoku Conversion Line(9,26) <= 1 days ago Ichimoku Base Line(26,52)]]
Add the 3rd, and see if that cleans it up.
Extra tip for non Ichimoku users. I find the Ichimoku Full to be busy. But that is because I have a high chart Opacity on the Price. Lowering the Chart opacity to a 0.2 brings the Ichi Full to the forefront.0


Categories
- All Categories
- 2.3K StockCharts
- 395 SharpCharts
- 146 Other Charting Tools
- 69 Saved Charts and ChartLists
- 1.5K Scanning
- 74 Data Issues
- 177 Other StockCharts Questions
- 218 Technical Analysis
- 155 Using Technical Analysis
- 2 InterMarket and International
- 19 Market and Breadth Indicators
- 42 Market Analysis
- 109 Trading
- 109 Trading Strategies
- 163 S.C.A.N the StockCharts Answer Network forum
- 65 Using this StockCharts Answer Network forum
- 98 s.c.a.n. archives
- 5 Off-Topic
- 6 The Cogitation & Rumination Emporium
- Forum Test Area