New Members: Be sure to confirm your email address by clicking on the link that was sent to your email inbox. You will not be able to post messages until you click that link.
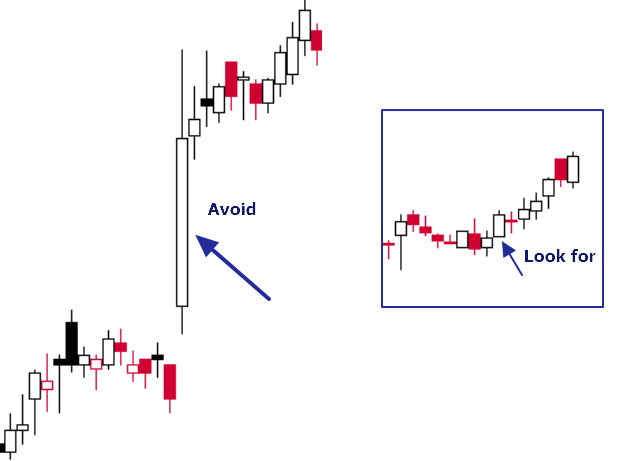
Avoid Long Candles

Comments
-
I've tried this (among others):
[ yesterday PPO Line(12,26,9) < PPO Line(12,26,9) *1.02 ]
to scan for yesterday's PPO Line smaller in size that today's PPO Line, but not more than 20%. I've also tried ">" but it didn't work.0 -
So a good measure of candle size is ATR but I find it to be a little less useful than using ROC. Using ROC(1), in conjunction with a Price Channel (PC) will show you the largest % change price movements. If it breaks the PC, it's the largest candle in that direction. Technically it's the largest % change for 1 period. It could be a gap taking up the space vs a complete candle, but it's often a good thing to be aware of. You could use ATR(1) with the same type of thinking but, ATR only measures in positive values, where the ROC measures both positive and negative values. ROC(1), in conjunction with a Price Channel will display the largest changes or "long candles"
So, for example, you can use ROC(1) greater than 1 days ago Upper Price Channel(13) or Less than 1 days ago Lower Price Channel. You can also use Min/Max ROC(1) <= 1 days ago min(13,ROC(1))] or ROC(1) >= 1 days ago max(13,ROC(1)).
You could sub ATR(1) but you would only be looking at the Upper Price Channel or the max value as it only measures in positive values.
I wouldn't necessarily "avoid" longest candles, as they can be very important candles depending on where they are in relation to the trend. Long candles Down are better approaching bottoms, often indicating climactic selling action. Long candles Down coming off tops are definitely worrisome as they often change the trend or stage. The same is true for long candles Up. Off of bottoming areas, they are more likely to be a sign of strength and long candles Up near tops are often climactic buying and prone to pullback or reversals. All of this is just my opinion.0 -
Maybe I don't understand what you are looking for but this seems to work:
[group is SP500]
and [range > ATR(10) * 3]
and [AbsVal(open - close) > range * .8]
The second line checks for a long body. So you wouldn't pick up wide range bars with long wicks or tails. If you want to include those, comment that line out.
You don't necessarily get results every day because it doesn't happen every day. For testing, change the scan date to random past dates.
If you are looking for stocks that have had this event over some period time, not just today (meaning the most recent market close), you could use max( ):
[group is SP500]
and [max(10,range) > ATR(10) * 3]
and [AbsVal(open - close) > range * .8]
ATR doesn't usually change that fast, but if it bothers you to compare past data to the current date's data, you could say:
[group is SP500]
and [max(10,range) > 10 days ago ATR(10) * 3]
and [AbsVal(open - close) > range * .8]
This actually seems to work a little better.
0 -
Thanks to both of you for the tips. That should give me plenty of data to play with!0
-
Is there a way to scan for small range with a short body using the logic as posted above by markd , please do share0
-
I didn't actually run this, but it should be right.
[group is SP500]
and [range < ATR(10) * .5] // today's range less than half the 10 day average range
and [AbsVal(open - close) < range * .5] // today's body less than half today's range
You can widen the range with .6, .7, etc. or narrow it with .4, .3, etc.0 -
"I'm so thankful for your support."0


Categories
- All Categories
- 2.3K StockCharts
- 397 SharpCharts
- 146 Other Charting Tools
- 69 Saved Charts and ChartLists
- 1.5K Scanning
- 74 Data Issues
- 177 Other StockCharts Questions
- 218 Technical Analysis
- 155 Using Technical Analysis
- 2 InterMarket and International
- 19 Market and Breadth Indicators
- 42 Market Analysis
- 109 Trading
- 109 Trading Strategies
- 163 S.C.A.N the StockCharts Answer Network forum
- 65 Using this StockCharts Answer Network forum
- 98 s.c.a.n. archives
- 5 Off-Topic
- 6 The Cogitation & Rumination Emporium
- Forum Test Area