New Members: Be sure to confirm your email address by clicking on the link that was sent to your email inbox. You will not be able to post messages until you click that link.
Suggestions to StockCharts
Comments
-
New SharpCharts Workbench
Chip asked us to send in issues between the Classic Workbench and the New for things that we use that are not on the New Workbench or things that we'd suggest to improve it.
So don't be surprised if you get an influx of these requests.
On the Classic there is a dropdown for ChartStyles and at the bottom of that dropdown listing are additional chartstyles listed under Predefined. The Predefined chartstyles are not listed in the New workbench dropdown. I use this feature on the Classic to get quick access to the "expert" chartstyles you have available.
Please Add the additional Predefined chartstyles to the CHARTSTYLES dropdown listing at the top of the workbench.0 -
Got a response. One only has to CLICK on Chartstyle Library then CLICK on the Select Library dropdown, then CLICK to select a category of Libraries, then CLICK to select the chartstyle of interest (a preview appears) and then CLICK to Apply Chartstyle to get it into the Workbench.
Then CLICK on the Chart Settings link to see the workbench again.
YES, that is the response.
So, a one click dropdown and click to select is now 6 clicks and you have to know the route.0 -
Well sir, I will not be much help for charts, as have no real use ever here for them at all.
What I tried to get = no result was database structure & order = which knowing field & column order that is 'stored' ='s proper order to apply in scans = reduced time
Again, SIMPLE request
ps...scan function appendix layout = [like they taught ya in grammar school when ya readin a book at end for fast lookup] = seek, and ye shall find = way to easily !!
DUH
https://ta-lib.org/functions/
and another fwiw here is the "stable"
https://www.highcharts.com/demo
result set of those two?
Here's the church and there's the steeple.
Open the door and see all the people.
https://nurseryrhymescollections.com/lyrics/heres-the-church.html0 -
I don't think you need to know the database structure to write efficient scans. Also, the answer may not be as simple as you think it is. Database technology has changed a lot.
First, these days, with the processor speed and memory capacity available today, even a poorly written scan will run in a blink of an eye from the user's point of view.
Second, after the interpreter gets done translating your scan into machine language, it won't look like your scan anyway.
Third, the speed of processing doesn't depend on the location of data on the individual record. It depends on how many records have to be looked at. So, if you want to write an efficient scan, you would order your logic by the fewest records fitting the criteria first.
So, let's say you want MACD Line crossing above MACD signal where price is above the SMA 200 and volume is three time the 20 day average and the stock is in the Industrial sector.
You would not put MACD Line x MACD signal first, because lots of stocks not in the Industrial sector would also do that so they don't need to be looked at all. Likewise the other conditions. So you want to move from the least general to the most general i.e. least hits likely to most hits likely, so the scan looks at the fewest records (not the fewest fields in the record).
So the first line of the scan is
[group is IndustrialSector]
Then you would decide which is the next least likely. Probably 3x average volume (but not necessarily, so it's a toss up). So the next line would be
and [volume > sma(20, volume) * 3)]
next least likely
and [close > sma(200,close)]
and now finally
and [MACD Line(12,26,9) x MACD Signal(12,26,9)]
But again, probably no matter the order, on your side you wouldn't notice the difference in processing time. And even if it did matter, it would likely be cancelled out by events on the web between your machine and the SC server.0 -
For those of us still using the Classic SharpCharts workbench, we know that workbench will be going away by the end of the year. StockCharts.com is looking for feedback on the New workbench to make improvements and eliminate the differences between the two. Please Classic Users, start looking at the New to see what is different and what is or isn't on the New that you used in the Classic.
I made a suggestion to StockCharts.com Support regarding a difference I noted between the Classic and the New Sharpcharts workbenches based on my usual processes. I will often be viewing a Chartlist in Chartlist View and will want to modify the chartstyle I have saved to the Chartlist.
There are a couple different ways to change the chartstyle in the chartlist, but my most common way is to click on the chart in the ChartList View. This opens the chart in the SharpCharts workbench. I then make the change and the use the Apply to All (in Classic) or Apply ChartStyle to All (in New), to apply that chartstyle to all the symbols in the chartlist.
I would then click on the View All (in Classic) and it would take me back to the ChartList View, with the updated chartstyle showing, in the same tab.
In the New workbench you have to click on the View As dropdown at the top of the chart. Selecting ChartList View from here would open a new tab to view the ChartList.
I requested that they eliminate the opening of the new tab and provide the same functionality that the Classic offered by using the Same tab for this type of action.
They implemented that request on the New workbench within 48 hours.
Classic users should be using the New as much as possible so that you can hit the road running when Classic goes away. Make suggestions to Support on things that are different from your normal procedures and routines. They will be able to assist, either with instructions or by changing the New to providing the functionality you desire.0 -
The Advanced Editor in the Advanced Scan Workbench will become the default in the Scan Workbench at some point.
If you are not using the Advanced Editor, be advised that if you run a scan and then go back into that scan and add/change a line in the scan, and then run it again, those changes will not be reflected in the scan results. You would need to save the scan after you add/change the lines to get those lines to be part of the scan.
If you are doing this using the Advanced Editor, those add/changes ARE used if you run the scan. You don't have to save it first.
I made a suggestion to Support to change the font color on the parameters on the Advanced Editor to Black. They currently are Orange, which I find more difficult to read than a darker font. As the parameter is a very important part of the scan, it would be nice to have a more legible font color to enhance the user experience in my opinion.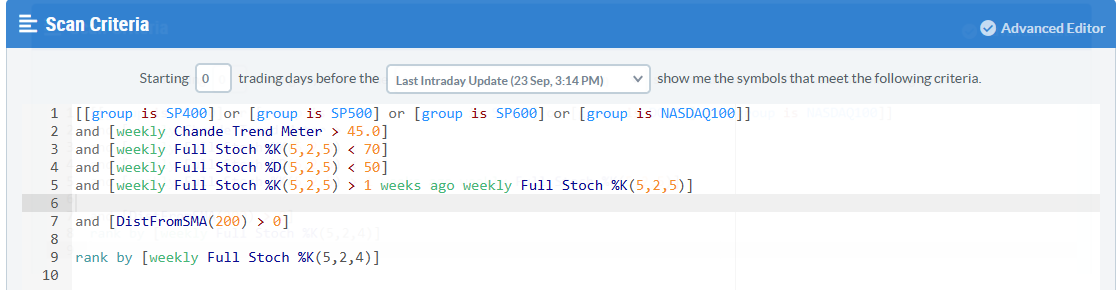
I'm getting older by the day, and I do prefer the standard workbench, mostly because the font is larger and all black so it's easier for me to read, but the Advanced Editor being default does have some advantages as it opens up new possibilities for enhancements. I'd like a non-existant chartlist to be flagged in the Check Syntax for example.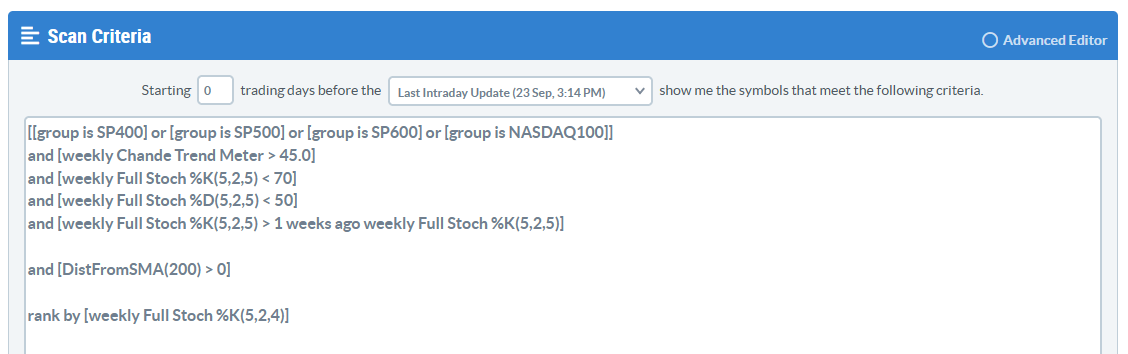
0 -
I took to the advanced editor right away.
I'm indifferent to orange, and the other color choices, so I wouldn't object to a change.
I noticed the parameters in the "rank by" statement aren't orange.0 -
They darkened the Orange last night. Claimed that black wouldn't be an option.0


Categories
- All Categories
- 2.3K StockCharts
- 396 SharpCharts
- 146 Other Charting Tools
- 69 Saved Charts and ChartLists
- 1.5K Scanning
- 74 Data Issues
- 177 Other StockCharts Questions
- 218 Technical Analysis
- 155 Using Technical Analysis
- 2 InterMarket and International
- 19 Market and Breadth Indicators
- 42 Market Analysis
- 109 Trading
- 109 Trading Strategies
- 163 S.C.A.N the StockCharts Answer Network forum
- 65 Using this StockCharts Answer Network forum
- 98 s.c.a.n. archives
- 5 Off-Topic
- 6 The Cogitation & Rumination Emporium
- Forum Test Area